
Page 210 - 34-2
P. 210
The Regulation of Non-GAAP Reporting and Earnings Management: Evidence from the Recognition of
Opportunistic Special Items
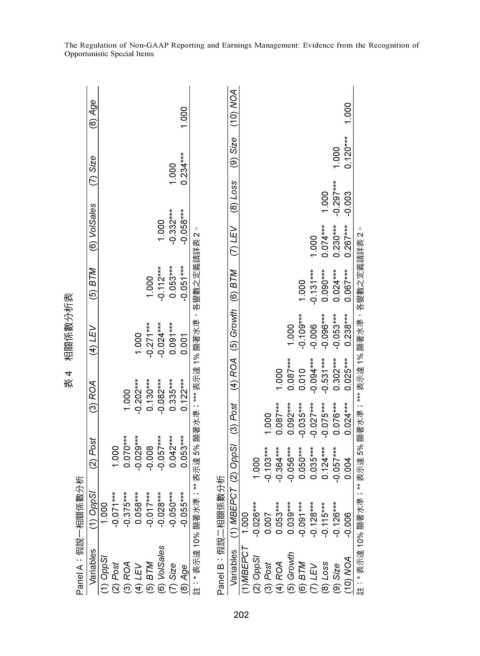
(8) Age 1.000 (10) NOA 1.000
(7) Size 1.000 0.234*** (9) Size (8) Loss 1.000 -0.297*** 0.120***
(6) VolSales 1.000 -0.332*** -0.058*** 2。 (7) LEV 1.000 1.000 0.074*** 0.230*** -0.003 0.267*** 2。
(5) BTM 1.000 -0.112*** 0.053*** -0.051*** 顯著水準,各變數之定義請詳表 (6) BTM 1.000 -0.131*** 0.090*** 0.024*** 0.067*** 顯著水準,各變數之定義請詳表
4 相關係數分析表 (4) LEV 1.000 -0.271*** -0.024*** 0.091*** 0.001 1% (5) Growth 1.000 -0.109*** -0.006 -0.096*** -0.053*** 0.238*** 1%
表 表示達 (4) ROA 1.000 0.087*** 0.010 -0.094*** -0.531*** 0.302*** 0.025*** 表示達
(3) ROA 1.000 -0.202*** 0.130*** -0.082*** 0.335*** 0.122*** 顯著水準;*** (3) Post 1.000 0.087*** 0.092*** -0.035*** -0.027*** -0.075*** 0.076*** 0.024*** 顯著水準;***
(2) Post 1.000 0.070*** -0.029*** -0.008 -0.057*** 0.042*** 0.053*** 5% 表示達 (2) OppSI 1.000 -0.103*** -0.364*** -0.056*** 0.050*** 0.035*** 0.124*** -0.057*** 0.004 5% 表示達
Panel A:假說一相關係數分析 (1) OppSI Variables 1.000 (1) OppSI -0.071*** -0.375*** 0.058*** -0.017*** -0.028*** (6) VolSales -0.050*** -0.055*** 顯著水準;** 10% 註:* 表示達 Panel B:假說二相關係數分析 (1) MBEPCT Variables 1.000 (1)MBEPCT -0.026*** (2) OppSI 0.007 0.053*** 0.039*** (5) Growth -0.091*** -0.128*** -0.115*** -0.126*** -0.006 顯著水準;** 10% 註:* 表示達
(3) ROA
(5) BTM
(7) Size
(2) Post
(4) LEV
(8) Age
202 (3) Post (4) ROA (6) BTM (7) LEV (8) Loss (9) Size (10) NOA