


 107 /304

107
臺大管理論叢
第
28
卷第
1
期
CSR announcement date to the CSR announcement date (
T
0
) and we also incorporate
MP
i,l,[T
0
,T
2
]
from
T
0
to
T
2
days afterwards;
l
equals 1 to
L
,
L
is the number of media proxies.
INT
i,l
is the interaction term which includes three variables, with
CSR
i,T
0
interacting
with
MP
i,l
during the period from
T
3
days prior to the CSR announcement date to the CSR
announcement date (
T
0
) and we also incorporate
INT
i,l,[T
0
,T
2
]
from
T
0
to
T
2
days afterwards.
Time
T
0
refers to those CSR award announcements made in the current year; time
T
2
refers
to the quarterly financial statement announcements after the CSR award announcements;
and time –
T
3
refers to the quarterly financial statement announcements prior to the CSR
award announcements.
4. Empirical Results
4.1 The Relationship between CSR and Non-CSR Firms
We now provide analysis of the trend in media coverage, the sentiment ratio, stock
returns and CARs around the CSR awards announcement periods. The results are
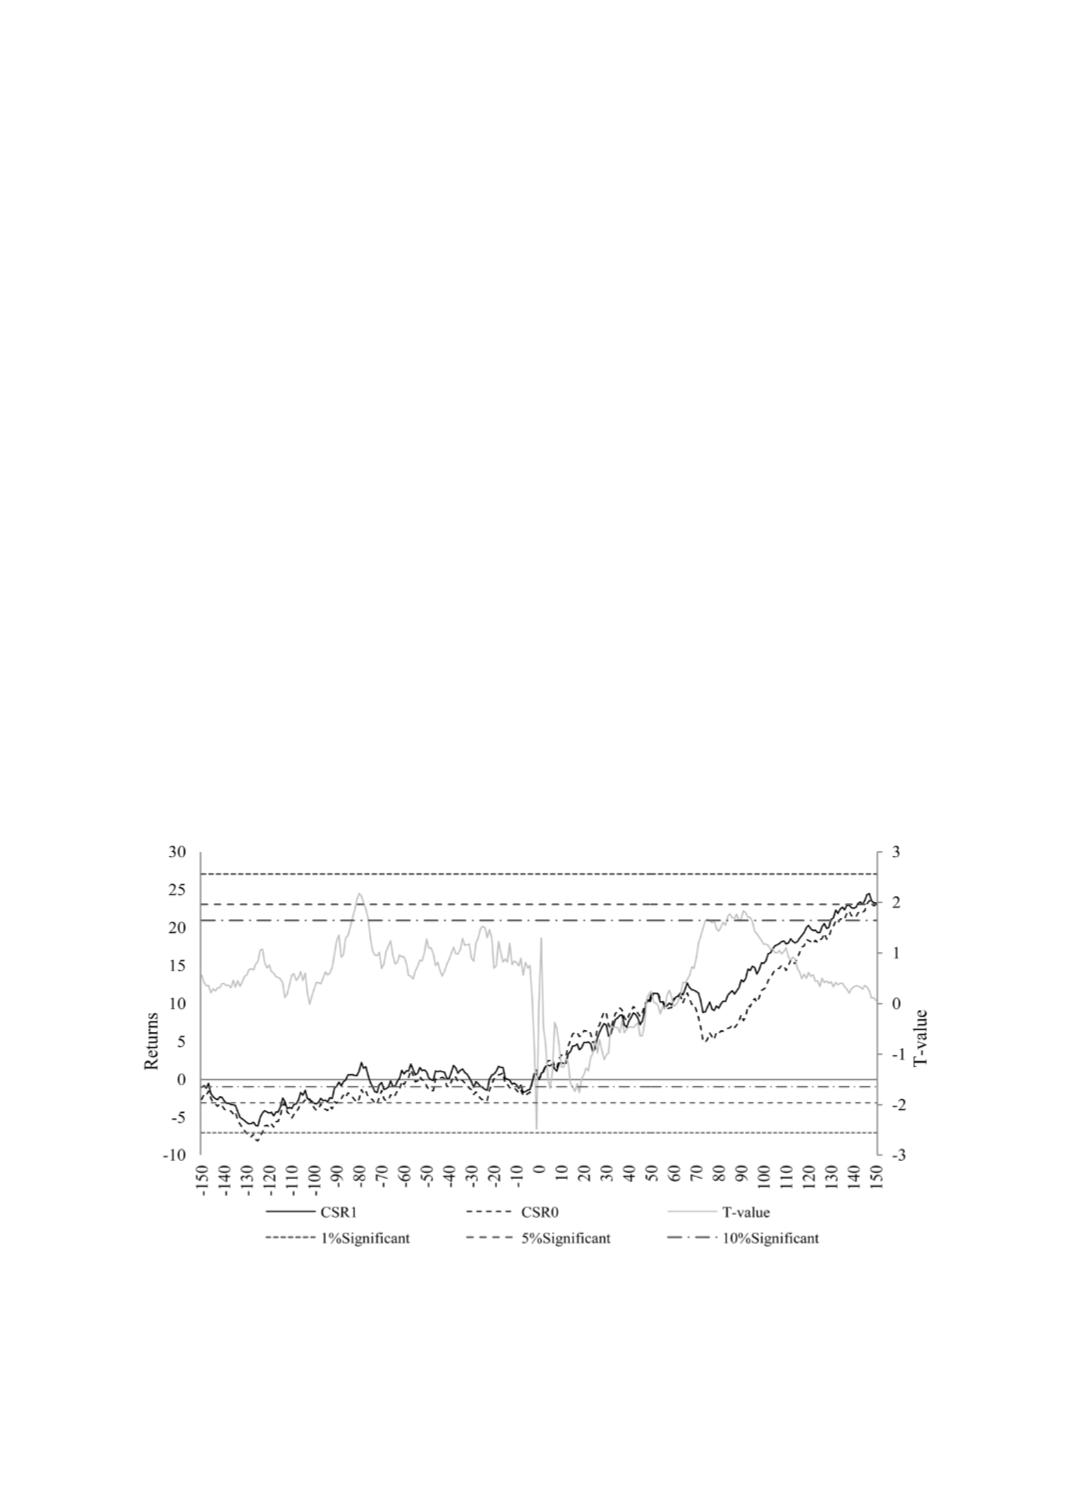
illustrated in Figures 3 and 4, which respectively illustrate the stock returns and CARs for
both CSR winners and non-CSR firms. As we can see from Figure 3, the patterns of the
stock returns of CSR winners being found to be significantly higher than those of non-
CSR firms around 70-90 days after CSR award announcements.
Figure 3 Evolution and t Test of Stock Returns
Note: This figure illustrates the stock returns for 150 trading days prior to and after the announcement
of CSR awards. CSR1 refers to the stock returns of CSR winners; and CSR0 refers to the stock
returns of non-CSR firms. The t value is a sample t test of CSR1 and CSR0.