
Page 169 - 35-1
P. 169
NTU Management Review Vol. 35 No. 1 Apr. 2025
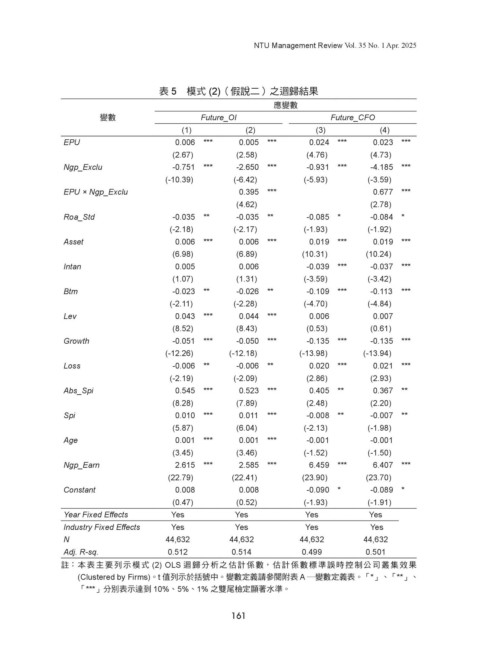
表 5 模式 (2)(假說二)之迴歸結果
應變數
變數 Future_OI Future_CFO
(1) (2) (3) (4)
EPU 0.006 *** 0.005 *** 0.024 *** 0.023 ***
(2.67) (2.58) (4.76) (4.73)
Ngp_Exclu -0.751 *** -2.650 *** -0.931 *** -4.185 ***
(-10.39) (-6.42) (-5.93) (-3.59)
EPU × Ngp_Exclu 0.395 *** 0.677 ***
(4.62) (2.78)
Roa_Std -0.035 ** -0.035 ** -0.085 * -0.084 *
(-2.18) (-2.17) (-1.93) (-1.92)
Asset 0.006 *** 0.006 *** 0.019 *** 0.019 ***
(6.98) (6.89) (10.31) (10.24)
Intan 0.005 0.006 -0.039 *** -0.037 ***
(1.07) (1.31) (-3.59) (-3.42)
Btm -0.023 ** -0.026 ** -0.109 *** -0.113 ***
(-2.11) (-2.28) (-4.70) (-4.84)
Lev 0.043 *** 0.044 *** 0.006 0.007
(8.52) (8.43) (0.53) (0.61)
Growth -0.051 *** -0.050 *** -0.135 *** -0.135 ***
(-12.26) (-12.18) (-13.98) (-13.94)
Loss -0.006 ** -0.006 ** 0.020 *** 0.021 ***
(-2.19) (-2.09) (2.86) (2.93)
Abs_Spi 0.545 *** 0.523 *** 0.405 ** 0.367 **
(8.28) (7.89) (2.48) (2.20)
Spi 0.010 *** 0.011 *** -0.008 ** -0.007 **
(5.87) (6.04) (-2.13) (-1.98)
Age 0.001 *** 0.001 *** -0.001 -0.001
(3.45) (3.46) (-1.52) (-1.50)
Ngp_Earn 2.615 *** 2.585 *** 6.459 *** 6.407 ***
(22.79) (22.41) (23.90) (23.70)
Constant 0.008 0.008 -0.090 * -0.089 *
(0.47) (0.52) (-1.93) (-1.91)
Year Fixed Effects Yes Yes Yes Yes
Industry Fixed Effects Yes Yes Yes Yes
N 44,632 44,632 44,632 44,632
Adj. R-sq. 0.512 0.514 0.499 0.501
註: 本表主要列示模式 (2) OLS 迴歸分析之估計係數,估計係數標準誤時控制公司叢集效果
(Clustered by Firms)。t 值列示於括號中。變數定義請參閱附表 A ―變數定義表。「*」、「**」、
「***」分別表示達到 10%、5%、1% 之雙尾檢定顯著水準。
161