


 163 / 372

臺大管理論叢
第
26
卷第
2
期
163
housing price volatility, and mortality assumption should be examined in terms of the value
of each component. Table 4 shows that an unexpected loss will occur for the insurance
provider when the rental rate and/or housing price volatility are underestimated, and when
the mortality (decremental) rate is overestimated. Owing to the existence of RM insurance,
the profit of mortgage issuer is independent of the rental rate and the housing price volatility.
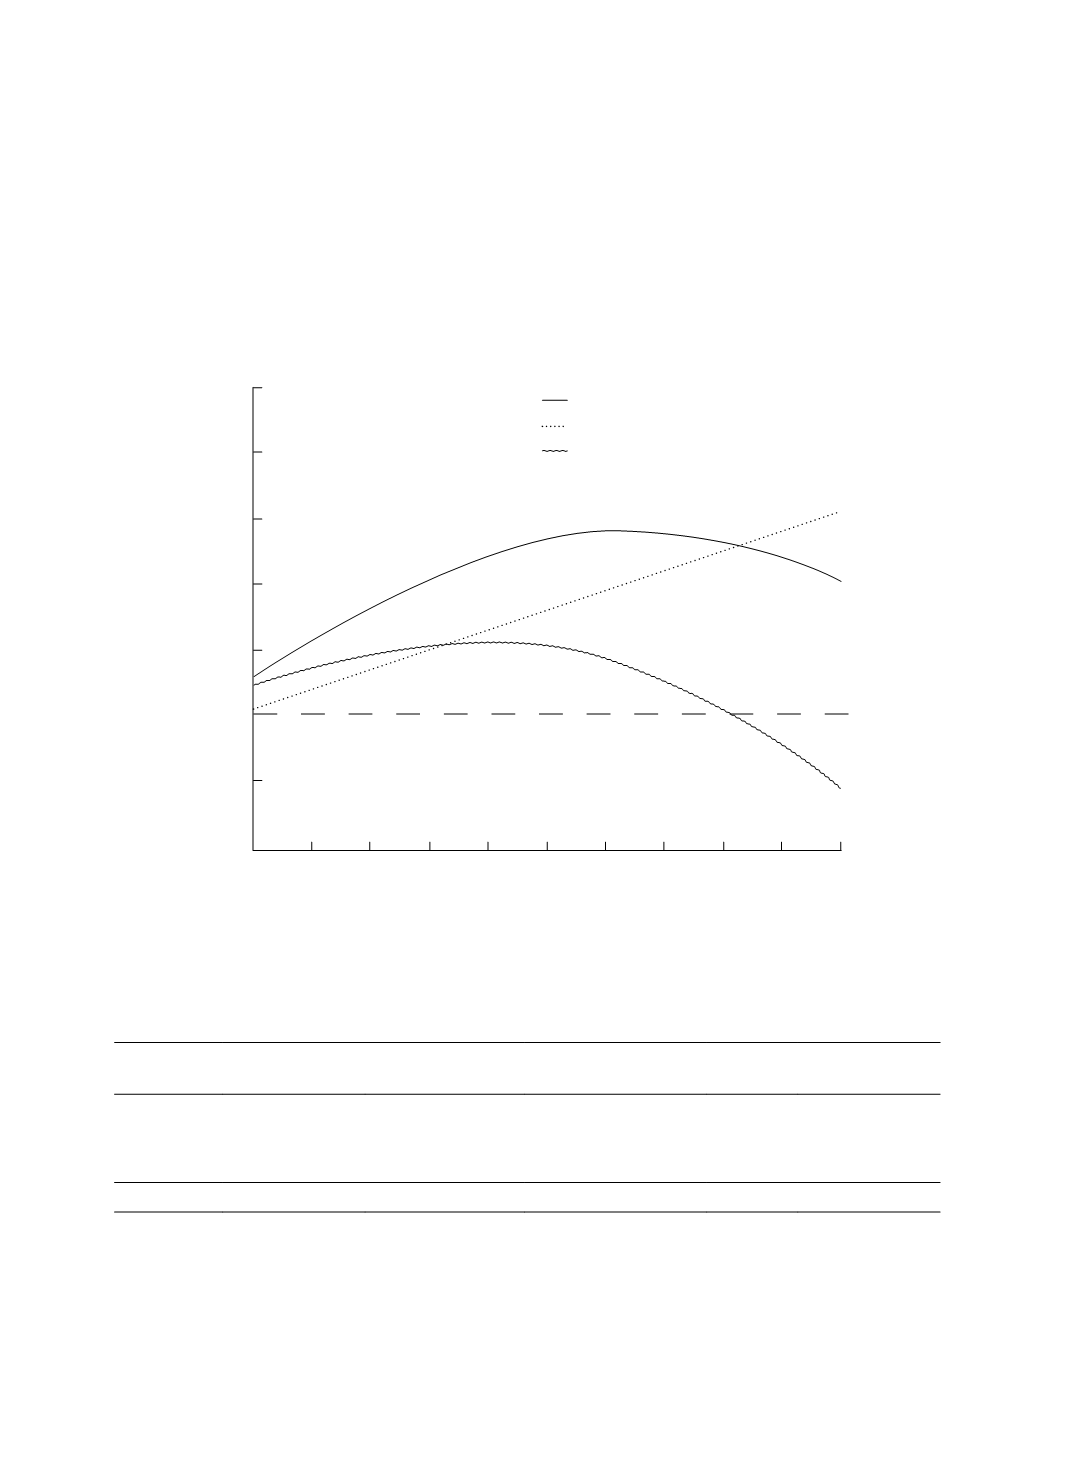
Figure 1 The Profitability versus the Loan to Value Ratio
loan to value ratio (%)
0.25
0.2
0.15
0.1
0.05
0
-0.05
-0.1
total profitability (%)
profitability of mortgage issuer (%)
profitability of insurance issuer (%)
0
5
10
15
20
25
30
35
40
45
50
Table 4 Sensitivity Analysis for a Specific Loan Amount
Rental Rate
Rental
Income
Remaining
Value
Insurance
Expenses
Profits
Cost of
Insurance
1.0%
137,883
277,664
120,765
129,915
80,517
2.0%
252,204
203,591
120,765
129,915 120,765
3.0%
347,448
152,880
120,765
129,915 165,297
Housing Price Volatility
2.5%
252,204
158,208
120,765
129,915
75,382
7.5%
252,204
182,908
120,765
129,915 100,082
12.5%
252,204
219,654
120,765
129,915 136,828