Page 161 - 35-1
P. 161

NTU Management Review Vol. 35 No. 1 Apr. 2025
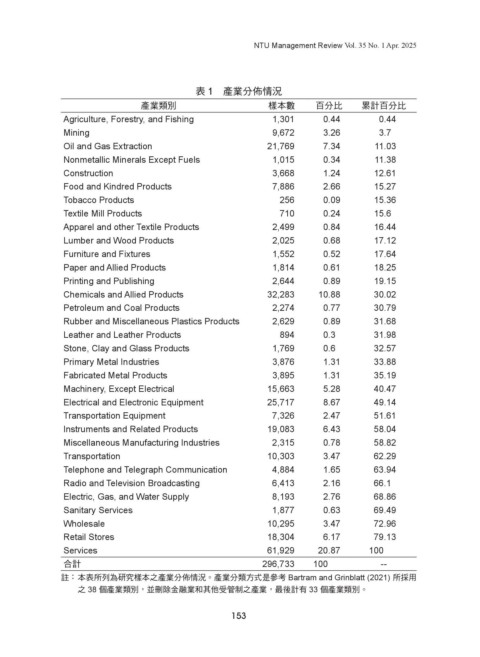


                                             表 1 產業分佈情況
                                 產業類別                        樣本數        百分比       累計百分比
               Agriculture, Forestry, and Fishing             1,301       0.44        0.44
               Mining                                         9,672       3.26        3.7
               Oil and Gas Extraction                        21,769       7.34       11.03
               Nonmetallic Minerals Except Fuels              1,015       0.34       11.38
               Construction                                   3,668       1.24       12.61
               Food and Kindred Products                      7,886       2.66       15.27
               Tobacco Products                                 256       0.09       15.36
               Textile Mill Products                            710       0.24       15.6
               Apparel and other Textile Products             2,499       0.84       16.44
               Lumber and Wood Products                       2,025       0.68       17.12
               Furniture and Fixtures                         1,552       0.52       17.64
               Paper and Allied Products                      1,814       0.61       18.25
               Printing and Publishing                        2,644       0.89       19.15
               Chemicals and Allied Products                 32,283     10.88        30.02
               Petroleum and Coal Products                    2,274       0.77       30.79
               Rubber and Miscellaneous Plastics Products     2,629       0.89       31.68
               Leather and Leather Products                     894       0.3        31.98
               Stone, Clay and Glass Products                 1,769       0.6        32.57
               Primary Metal Industries                       3,876       1.31       33.88
               Fabricated Metal Products                      3,895       1.31       35.19
               Machinery, Except Electrical                  15,663       5.28       40.47
               Electrical and Electronic Equipment           25,717       8.67       49.14
               Transportation Equipment                       7,326       2.47       51.61
               Instruments and Related Products              19,083       6.43       58.04
               Miscellaneous Manufacturing Industries         2,315       0.78       58.82
               Transportation                                10,303       3.47       62.29
               Telephone and Telegraph Communication          4,884       1.65       63.94
               Radio and Television Broadcasting              6,413       2.16       66.1
               Electric, Gas, and Water Supply                8,193       2.76       68.86
               Sanitary Services                              1,877       0.63       69.49
               Wholesale                                     10,295       3.47       72.96
               Retail Stores                                 18,304       6.17       79.13
               Services                                      61,929     20.87       100
               合計                                           296,733    100            --
               註: 本表所列為研究樣本之產業分佈情況。產業分類方式是參考 Bartram and Grinblatt (2021) 所採用
                  之 38 個產業類別,並刪除金融業和其他受管制之產業,最後計有 33 個產業類別。


                                                     153
   156   157   158   159   160   161   162   163   164   165   166