
Page 29 - 34-3
P. 29
NTU Management Review Vol. 34 No. 3 Dec. 2024
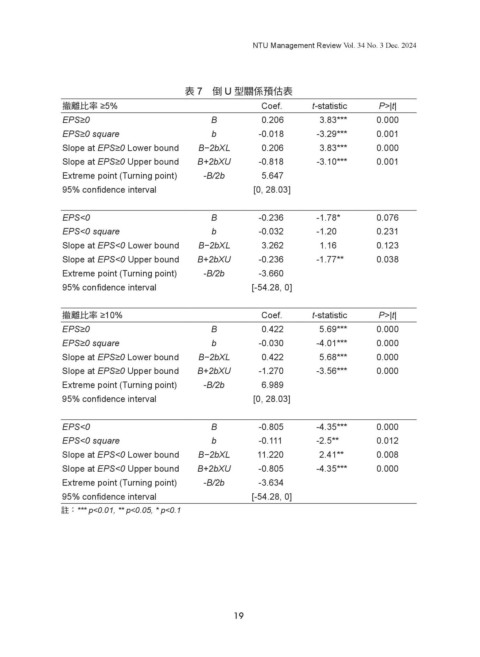
表 7 倒 U 型關係預估表
撤離比率 ≥5% Coef. t-statistic P>|t|
EPS≥0 B 0.206 3.83*** 0.000
EPS≥0 square b -0.018 -3.29*** 0.001
Slope at EPS≥0 Lower bound B−2bXL 0.206 3.83*** 0.000
Slope at EPS≥0 Upper bound B+2bXU -0.818 -3.10*** 0.001
Extreme point (Turning point) -B/2b 5.647
95% confidence interval [0, 28.03]
EPS<0 B -0.236 -1.78* 0.076
EPS<0 square b -0.032 -1.20 0.231
Slope at EPS<0 Lower bound B−2bXL 3.262 1.16 0.123
Slope at EPS<0 Upper bound B+2bXU -0.236 -1.77** 0.038
Extreme point (Turning point) -B/2b -3.660
95% confidence interval [-54.28, 0]
撤離比率 ≥10% Coef. t-statistic P>|t|
EPS≥0 B 0.422 5.69*** 0.000
EPS≥0 square b -0.030 -4.01*** 0.000
Slope at EPS≥0 Lower bound B−2bXL 0.422 5.68*** 0.000
Slope at EPS≥0 Upper bound B+2bXU -1.270 -3.56*** 0.000
Extreme point (Turning point) -B/2b 6.989
95% confidence interval [0, 28.03]
EPS<0 B -0.805 -4.35*** 0.000
EPS<0 square b -0.111 -2.5** 0.012
Slope at EPS<0 Lower bound B−2bXL 11.220 2.41** 0.008
Slope at EPS<0 Upper bound B+2bXU -0.805 -4.35*** 0.000
Extreme point (Turning point) -B/2b -3.634
95% confidence interval [-54.28, 0]
註:*** p<0.01, ** p<0.05, * p<0.1
19