
臺大管理論叢
第
26
卷第
3
期
163
where
and
respectively stand for the expected and unexpected component
of spot index volatility. We calculate the three volatility measures developed by Parkinson
(1980), Garman and Klass (1980), and Rogers and Satchell (1991) and perform regression
using each measure as explanatory variable. For each spot volatility measure, we partition it
into the expected and unexpected volatilities using ARIMA model as described in section
3.1. Remaining variables are defined as previously. The findings of positive and significant
φ
5
and/or
φ
6
corresponds to implication (4), that the unexpected spot volatility affects open
interest, and is consistent with the hypothesis that open interest reflects hedging demand.
Finally, we construct Model (7) and Model (8) to test implications (5) and (6) of
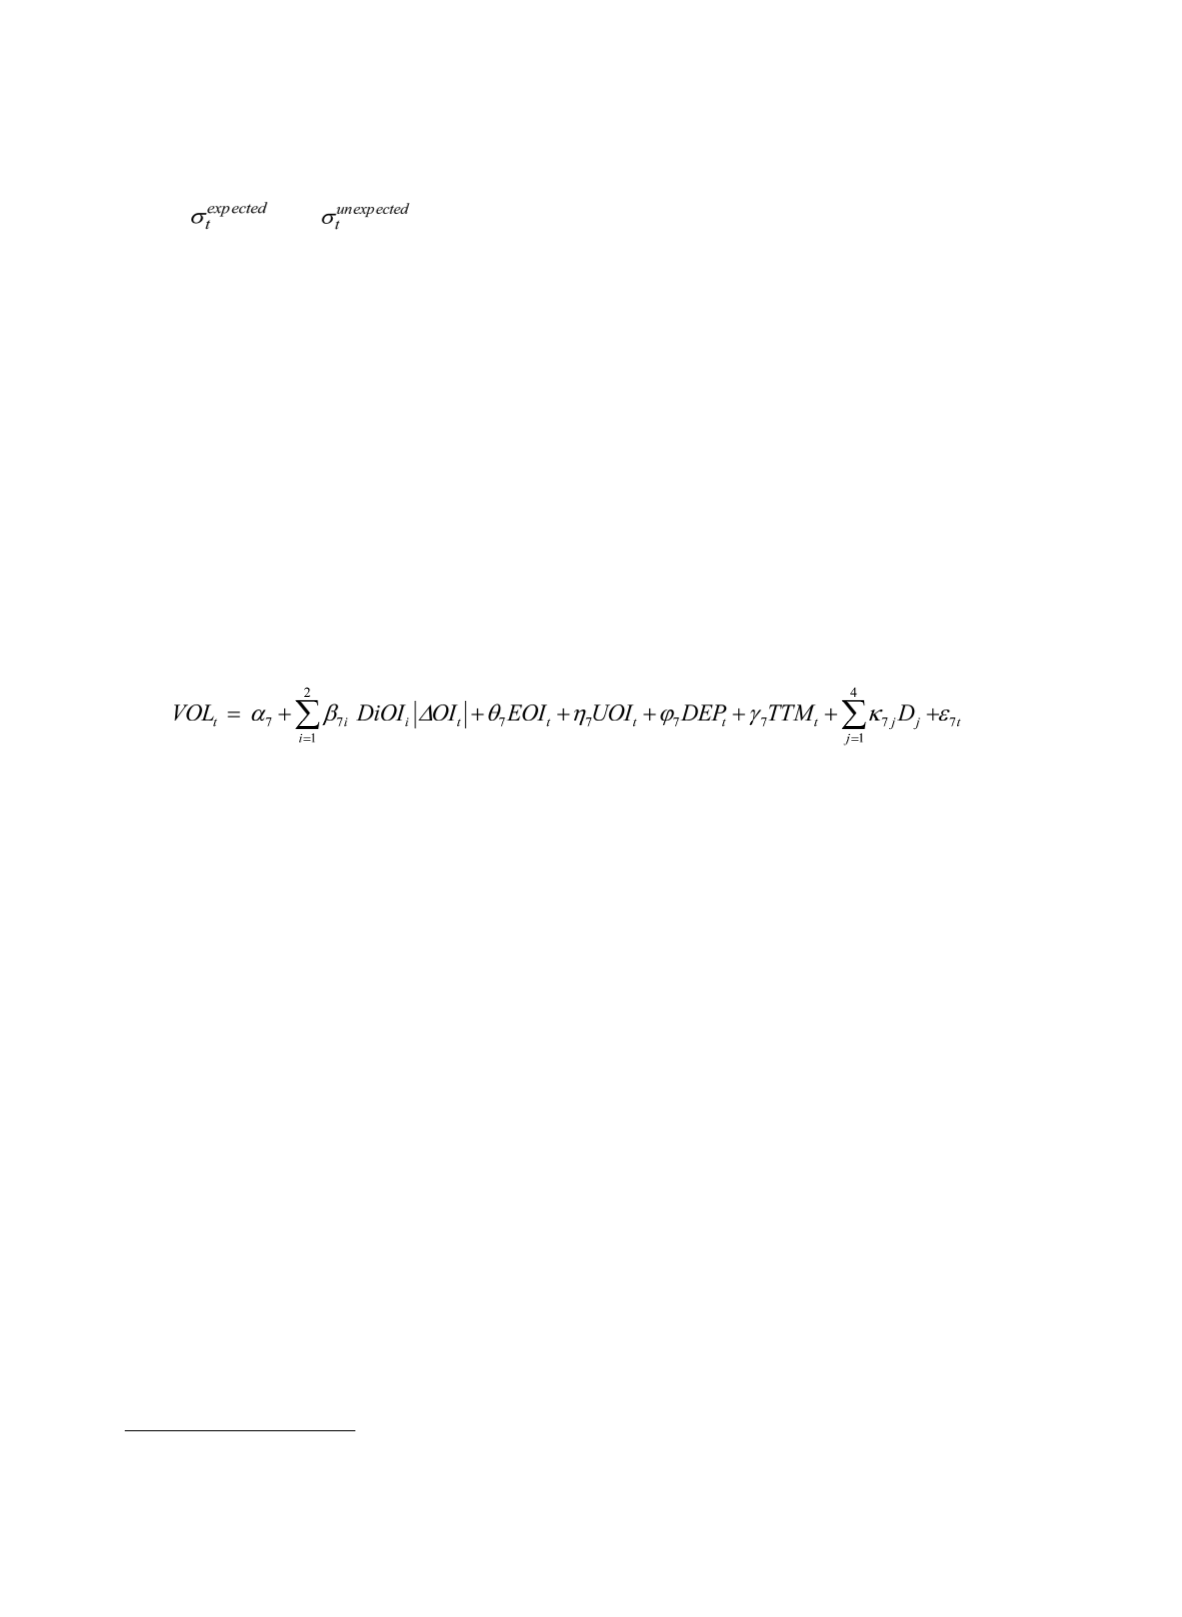
Hypothesis 3 that open interest reflects differences of opinion. Model (7) resembles the
empirical model in Bessembinder et al. (1996), designed to test the influence of the variation
in open interest on trading volume (
VOL
).
(7)
where |
ΔOI
| measure the absolute change of open interest. To separately measure the impact
of increment and decrement in open interest on volume, we follow Bessembinder et al.
(1996) by using the unsigned change in open interest (|
ΔOI
|), and multiplied by two dummy
variables (
DiOI
i
,
I
= 1,2) for cases of upward and downward
OI
movement. This allows us to
model the asymmetrical impacts on the volume. If open interest increases (i.e.,
ΔOI
> 0), the
first dummy (
DiOI
1
) equals one and the second dummy (
DiOI
2
) equals zero. If open interest
falls (i.e.,
ΔOI
< 0), the second dummy (
DiOI
2
) equals one and the first dummy (
DiOI
1
)
equals zero. So
β
71
, the coefficient of
DiOI
1
|
ΔOI
|, represents the impact from the
increment
in
open interest on volume, whereas
β
72
, the coefficient of
DiOI
2
|
ΔOI
|, represents the impact
from the
decrement
in open interest on volume. Implication (5) predicts an asymmetric
influence on volume from upward
OI
versus downward
OI
. The finding of greater
β
71
than
β
72
, that is, the positive impact on volume due to open interest increments is greater than the
negative impact due to open interest decrements, supports the implication.
In Model (7), we use expected open interest (
EOI
), unexpected open interest (
UOI
),
market depth (
DEP
),
TTM
and dummies for the day-of-the-week effect as control variables.
8
All control variables are defined as previously.
8 We thank an anonymous referee for suggesting that the independent variables used in Hypothesis 1
should be controlled in Hypothesis 3, and vice versa.


