


 169 / 322

臺大管理論叢
第
26
卷第
3
期
169
The effect of either expected volatility or unexpected volatility on the unexpected open
interest (
UOI
) is not confirmed. The coefficients for the unexpected volatility (
ϕ
6
) in the
three regressions for Model (6) are not statistically significant. It is consistent with Model (4)
that volatility is less correlated with unexpected open interest.
In sum, we find that the expected open interest is significant correlated with the
predicted volatility and volatility shock, whereas the unexpected open interest is not. Results
in general support Hypothesis 2, that open interest contains information about the latent
hedging demand.
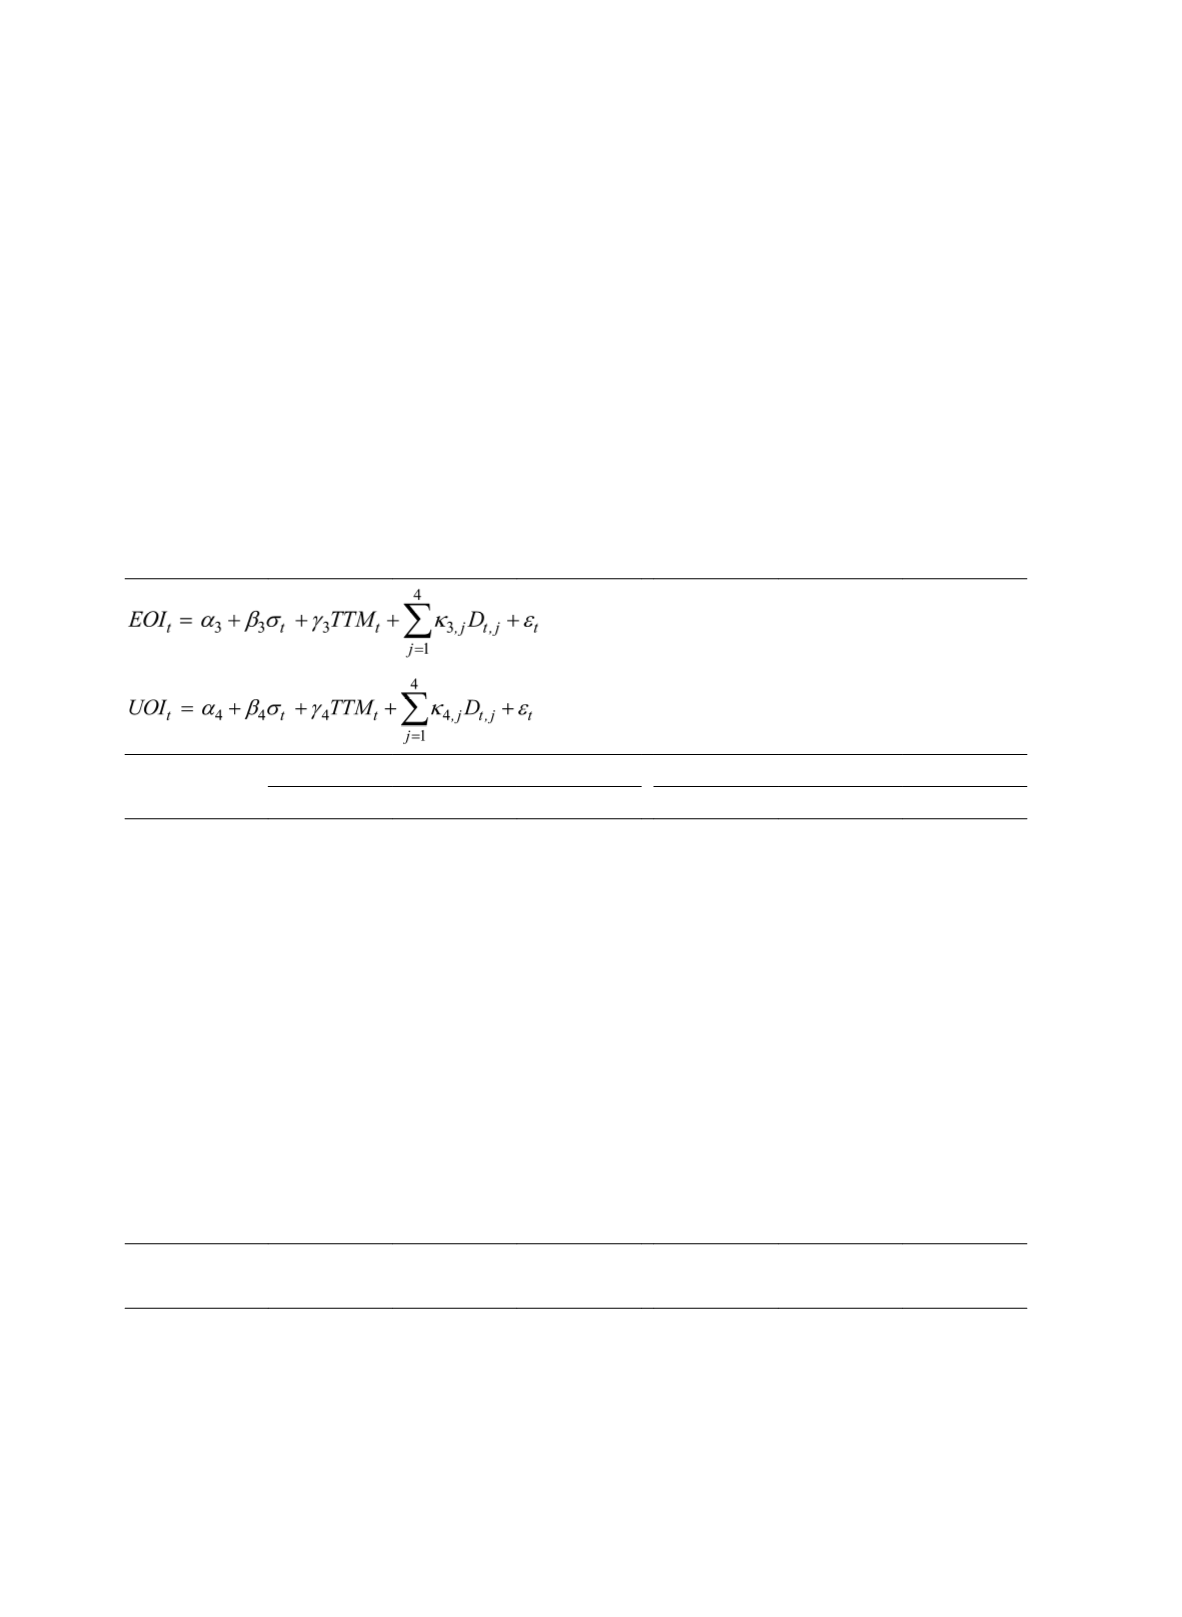
Table 4 Regressions of Open Interest on Spot Index Volatility
(3)
(4)
Volatility
Proxies
Model (3)
Model (4)
Parkinson
t
GK
t
RS
t
Parkinson
t
GK
t
RS
t
Intercept (
α
)
50,170
a
(49.77)
50,101
a
(49.67)
50,247
a
(49.96)
2,551
a
(10.95)
2,582
a
(11.07)
2,603
a
(11.20)
Volatility (
β
)
9.05
a
(3.63)
11.71
a
(3.86)
10.42
a
(3.45)
-0.19
(-0.33)
-0.64
(-0.91)
-0.996
(-1.43)
TTM
t
(
γ
)
-119.61
a
(-3.45)
-121.42
a
(-3.50)
-121.65
b
(-3.51)
-84.23
a
(-10.50)
-84.15
a
(-10.49)
-84.07
a
(-10.49)
Monday (
κ
1
)
-2,459b
(-2.42)
-2,431
b
(-2.39)
-2,413
b
(-2.37)
-472.57
b
(-2.01)
-473.03
b
(-2.01)
-474.66
b
(-2.02)
Tuesday (
κ
2
)
-691.29
(-0.69)
-698.12
(-0.70)
-704.15
(-0.70)
-134.77
(-0.58)
-133.88
(-0.58)
-132.38
(-0.57)
Thursday (
κ
3
)
251.00
(0.25)
198.66
(0.20)
174.70
(-0.70)
-3,087
a
(-13.37)
-3,083
a
(-13.35)
-3,076
a
(-13.32)
Friday (
κ
4
)
-2,230
b
(-2.23)
-2,262
b
(-2.26)
-2,268
b
(-2.26)
-639.51
a
(-2.76)
-637.21
a
(-2.75)
-634.66
a
(-2.74)
H
0
: All
κ
= 0
3.03
b
2.97
b
2.92
b
59.33
a
59.16
a
58.92
a
Adj. R
2
0.0128
0.0136
0.0122
0.1395
0.1398
0.1402
Note: The OLS regression Model (3) and (4) examine the implications of Hypothesis 2 by regressing
open interest on proxies of spot index volatility.
EOI
t
, and
UOI
t
are, respectively, the expected
and unexpected component of open interest partitioned from
OI
t
using ARIMA model, where
OI
t
is the open interest of the two nearest expiration futures contracts.
σ
is the spot volatility proxy,
which is measured by Parkinson (1980), Garman and Klass (1980) and Rogers and Satchell