
期貨未平倉量的資訊內涵及其交易活動之研究
160
(2) We follow the method proposed by Bessembinder and Seguin (1993) to decompose
open interest (
OI
) into its expected and unexpected components using an ARIMA
[(1,3,19,20,21), 0, (3,24,26,39,44)] process (see Appendix A). The expected open interest
(
EOI
) is the fitted value of the ARIMA model, while the unexpected open interest (
UOI
) is
the difference between the actual open interest (
OI
) and expected open interest (
EOI
). The
expected portion represents the normal level of open interest measured by the time series
model, while the unexpected portion captures the change or innovation of open interest
beyond the prediction of the model.
(3) We calculate the market depth,
DEP
, by summing the order size on the best five bid
and ask prices on the limit order book. Daily market depth is the weighted average of the
intraday depths, where the weight is the elapsed time of each intraday depth record.
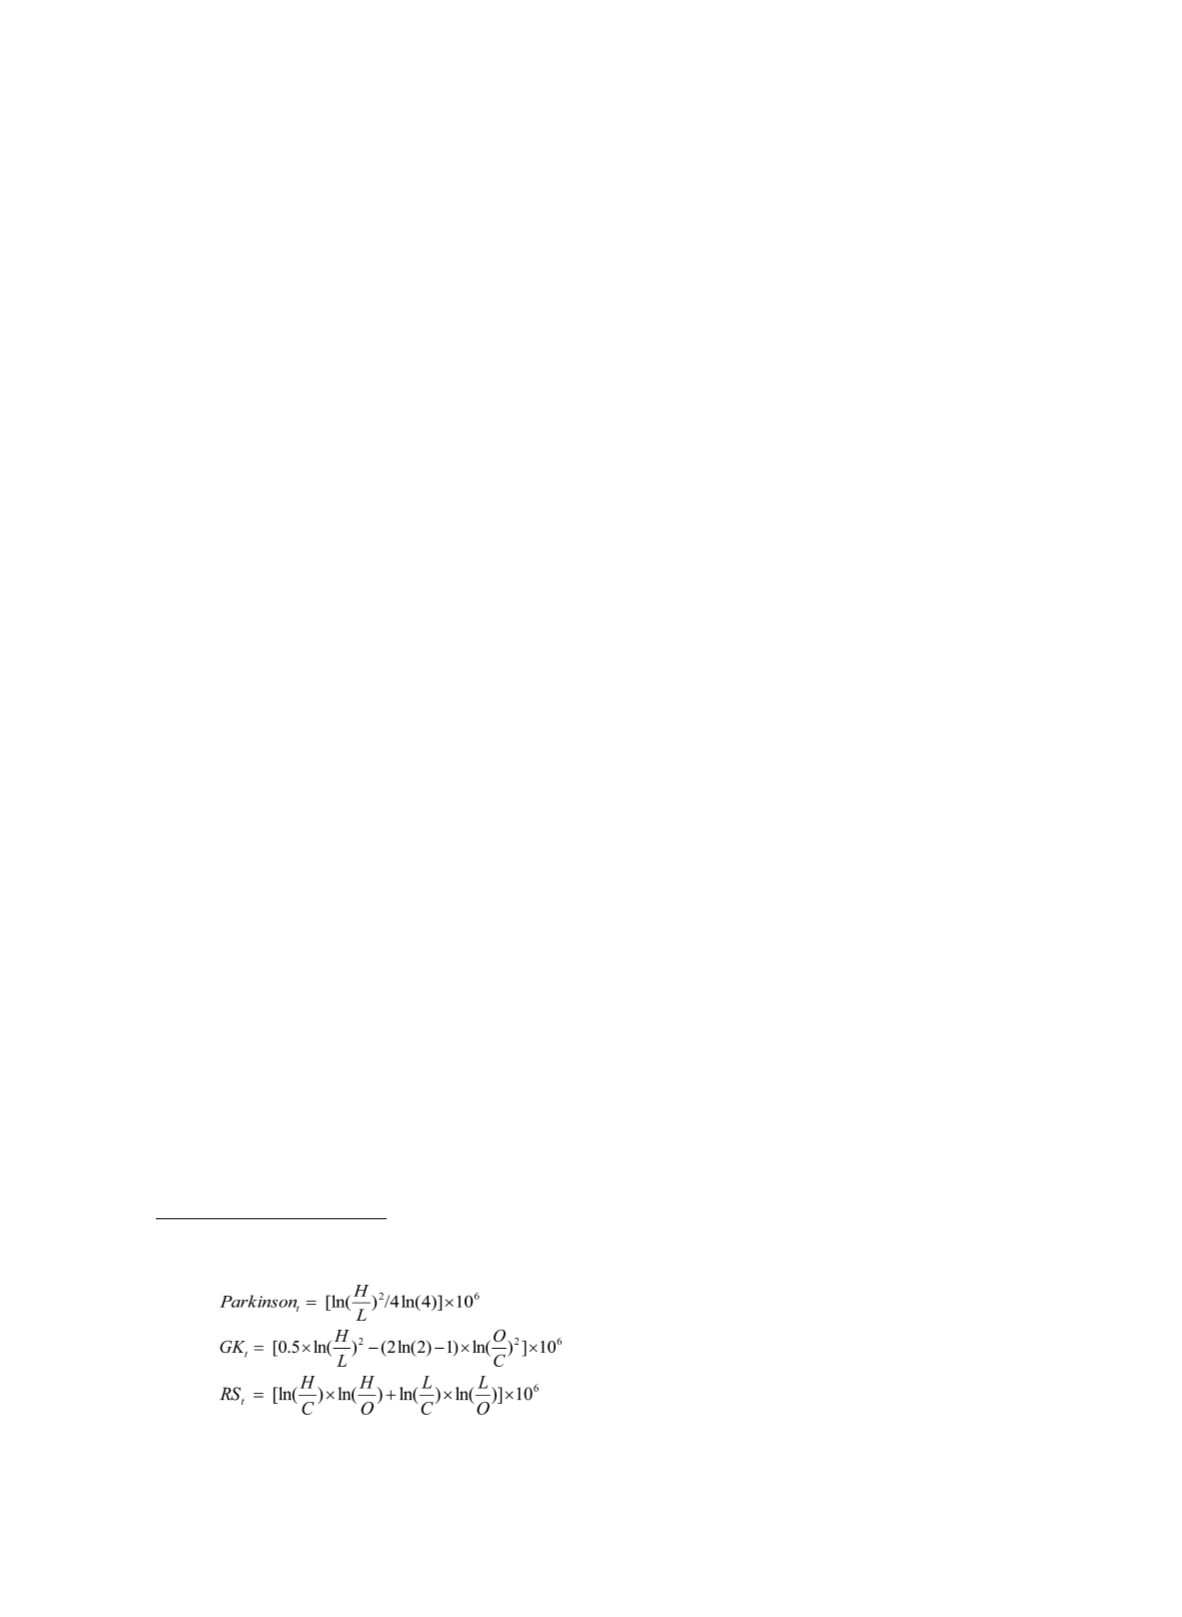
(4) For volatility variables, Garman and Klass (1980) assert that the daily price ranges
contain more information about volatility, comparing to the volatility calculated from closing
prices only. We therefore select three volatility estimators using the full range of daily prices
proposed by Parkinson (1980), Garman and Klass (1980) (
GK
), and Rogers and Satchell
(1991) (
RS
).
6
All of them are decomposed into their expected and unexpected components
using the Box-Jenkins ARIMA model suggested by Bessembinder and Seguin (1993), the
same technique used for decomposing the open interest. They are separately identified as the
ARIMA [(1,4,9,10), 0, (1,4,25,26)], ARIMA [(2,7,15), 0, (1,2,5,17,25,27,33)] and ARIMA
[(1,12,15), 0, (2,17,25,32)] processes (see Appendix B). The residuals of the ARIMA model
are the unexpected component of volatility, and the differences between the actual volatility
and residuals are the expected volatility.
3.2 Empirical Models
We employ multiple regression analysis to test the three hypotheses about the
information contents of open interest. We construct eight models to verify every implication
6 The Parkinson, GK and RS volatility proposed by Parkinson (1980), Garman and Klass (1980) and
Rogers and Satchell (1991), respectively, are given in below:
where
H
,
L
,
C
, and
O
are the highest price, the lowest price, the closing price and the opening price,
respectively, on a daily basis. They are multiplied by 10
6
for adjustments of scale.


