
Page 120 - 34-1
P. 120
In-House Provision of Corporate Services: The Case of Property-Casualty Insurers and In-House Actuarial
Loss Reserve Certification
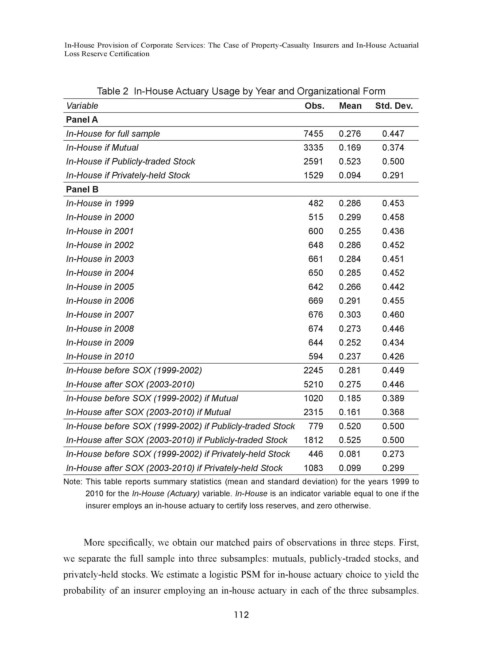
Table 2 In-House Actuary Usage by Year and Organizational Form
Variable Obs. Mean Std. Dev.
Panel A
In-House for full sample 7455 0.276 0.447
In-House if Mutual 3335 0.169 0.374
In-House if Publicly-traded Stock 2591 0.523 0.500
In-House if Privately-held Stock 1529 0.094 0.291
Panel B
In-House in 1999 482 0.286 0.453
In-House in 2000 515 0.299 0.458
In-House in 2001 600 0.255 0.436
In-House in 2002 648 0.286 0.452
In-House in 2003 661 0.284 0.451
In-House in 2004 650 0.285 0.452
In-House in 2005 642 0.266 0.442
In-House in 2006 669 0.291 0.455
In-House in 2007 676 0.303 0.460
In-House in 2008 674 0.273 0.446
In-House in 2009 644 0.252 0.434
In-House in 2010 594 0.237 0.426
In-House before SOX (1999-2002) 2245 0.281 0.449
In-House after SOX (2003-2010) 5210 0.275 0.446
In-House before SOX (1999-2002) if Mutual 1020 0.185 0.389
In-House after SOX (2003-2010) if Mutual 2315 0.161 0.368
In-House before SOX (1999-2002) if Publicly-traded Stock 779 0.520 0.500
In-House after SOX (2003-2010) if Publicly-traded Stock 1812 0.525 0.500
In-House before SOX (1999-2002) if Privately-held Stock 446 0.081 0.273
In-House after SOX (2003-2010) if Privately-held Stock 1083 0.099 0.299
Note: This table reports summary statistics (mean and standard deviation) for the years 1999 to
2010 for the In-House (Actuary) variable. In-House is an indicator variable equal to one if the
insurer employs an in-house actuary to certify loss reserves, and zero otherwise.
More specifically, we obtain our matched pairs of observations in three steps. First,
we separate the full sample into three subsamples: mutuals, publicly-traded stocks, and
privately-held stocks. We estimate a logistic PSM for in-house actuary choice to yield the
probability of an insurer employing an in-house actuary in each of the three subsamples.
112