
Page 123 - 34-1
P. 123
NTU Management Review Vol. 34 No. 1 Apr. 2024
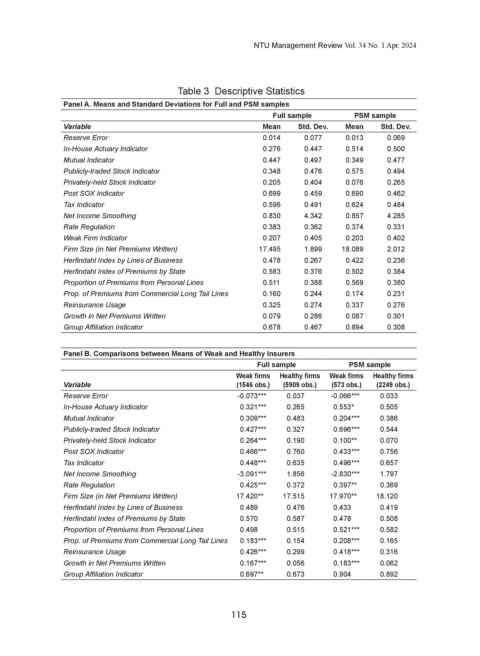
Table 3 Descriptive Statistics
Panel A. Means and Standard Deviations for Full and PSM samples
Full sample PSM sample
Variable Mean Std. Dev. Mean Std. Dev.
Reserve Error 0.014 0.077 0.013 0.069
In-House Actuary Indicator 0.276 0.447 0.514 0.500
Mutual Indicator 0.447 0.497 0.349 0.477
Publicly-traded Stock Indicator 0.348 0.476 0.575 0.494
Privately-held Stock Indicator 0.205 0.404 0.076 0.265
Post SOX Indicator 0.699 0.459 0.690 0.462
Tax Indicator 0.596 0.491 0.624 0.484
Net Income Smoothing 0.830 4.342 0.857 4.285
Rate Regulation 0.383 0.362 0.374 0.331
Weak Firm Indicator 0.207 0.405 0.203 0.402
Firm Size (in Net Premiums Written) 17.495 1.899 18.089 2.012
Herfindahl Index by Lines of Business 0.478 0.267 0.422 0.236
Herfindahl Index of Premiums by State 0.583 0.376 0.502 0.384
Proportion of Premiums from Personal Lines 0.511 0.388 0.569 0.380
Prop. of Premiums from Commercial Long Tail Lines 0.160 0.244 0.174 0.231
Reinsurance Usage 0.325 0.274 0.337 0.276
Growth in Net Premiums Written 0.079 0.286 0.087 0.301
Group Affiliation Indicator 0.678 0.467 0.894 0.308
Panel B. Comparisons between Means of Weak and Healthy Insurers
Full sample PSM sample
Weak firms Healthy firms Weak firms Healthy firms
Variable (1546 obs.) (5909 obs.) (573 obs.) (2249 obs.)
Reserve Error -0.073*** 0.037 -0.066*** 0.033
In-House Actuary Indicator 0.321*** 0.265 0.553* 0.505
Mutual Indicator 0.309*** 0.483 0.204*** 0.386
Publicly-traded Stock Indicator 0.427*** 0.327 0.696*** 0.544
Privately-held Stock Indicator 0.264*** 0.190 0.100** 0.070
Post SOX Indicator 0.466*** 0.760 0.433*** 0.756
Tax Indicator 0.448*** 0.635 0.496*** 0.657
Net Income Smoothing -3.091*** 1.856 -2.830*** 1.797
Rate Regulation 0.425*** 0.372 0.397** 0.369
Firm Size (in Net Premiums Written) 17.420** 17.515 17.970** 18.120
Herfindahl Index by Lines of Business 0.489 0.476 0.433 0.419
Herfindahl Index of Premiums by State 0.570 0.587 0.478 0.508
Proportion of Premiums from Personal Lines 0.498 0.515 0.521*** 0.582
Prop. of Premiums from Commercial Long Tail Lines 0.183*** 0.154 0.208*** 0.165
Reinsurance Usage 0.426*** 0.299 0.418*** 0.316
Growth in Net Premiums Written 0.167*** 0.056 0.183*** 0.062
Group Affiliation Indicator 0.697** 0.673 0.904 0.892
115