
Page 124 - 34-1
P. 124
In-House Provision of Corporate Services: The Case of Property-Casualty Insurers and In-House Actuarial
Loss Reserve Certification
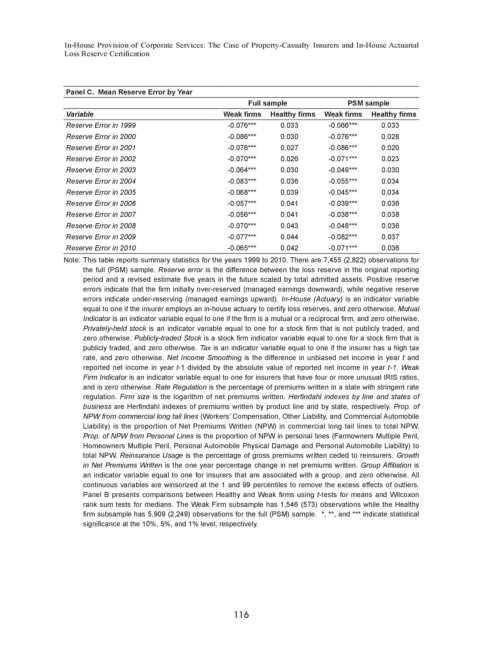
Panel C. Mean Reserve Error by Year
Full sample PSM sample
Variable Weak firms Healthy firms Weak firms Healthy firms
Reserve Error in 1999 -0.076*** 0.033 -0.066*** 0.033
Reserve Error in 2000 -0.086*** 0.030 -0.076*** 0.028
Reserve Error in 2001 -0.076*** 0.027 -0.086*** 0.020
Reserve Error in 2002 -0.070*** 0.026 -0.071*** 0.023
Reserve Error in 2003 -0.064*** 0.030 -0.049*** 0.030
Reserve Error in 2004 -0.083*** 0.036 -0.055*** 0.034
Reserve Error in 2005 -0.068*** 0.039 -0.045*** 0.034
Reserve Error in 2006 -0.057*** 0.041 -0.039*** 0.036
Reserve Error in 2007 -0.056*** 0.041 -0.038*** 0.038
Reserve Error in 2008 -0.070*** 0.043 -0.048*** 0.036
Reserve Error in 2009 -0.077*** 0.044 -0.082*** 0.037
Reserve Error in 2010 -0.065*** 0.042 -0.071*** 0.036
Note: This table reports summary statistics for the years 1999 to 2010. There are 7,455 (2,822) observations for
the full (PSM) sample. Reserve error is the difference between the loss reserve in the original reporting
period and a revised estimate five years in the future scaled by total admitted assets. Positive reserve
errors indicate that the firm initially over-reserved (managed earnings downward), while negative reserve
errors indicate under-reserving (managed earnings upward). In-House (Actuary) is an indicator variable
equal to one if the insurer employs an in-house actuary to certify loss reserves, and zero otherwise. Mutual
Indicator is an indicator variable equal to one if the firm is a mutual or a reciprocal firm, and zero otherwise.
Privately-held stock is an indicator variable equal to one for a stock firm that is not publicly traded, and
zero otherwise. Publicly-traded Stock is a stock firm indicator variable equal to one for a stock firm that is
publicly traded, and zero otherwise. Tax is an indicator variable equal to one if the insurer has a high tax
rate, and zero otherwise. Net Income Smoothing is the difference in unbiased net income in year t and
reported net income in year t-1 divided by the absolute value of reported net income in year t-1. Weak
Firm Indicator is an indicator variable equal to one for insurers that have four or more unusual IRIS ratios,
and is zero otherwise. Rate Regulation is the percentage of premiums written in a state with stringent rate
regulation. Firm size is the logarithm of net premiums written. Herfindahl indexes by line and states of
business are Herfindahl indexes of premiums written by product line and by state, respectively. Prop. of
NPW from commercial long tail lines (Workers’ Compensation, Other Liability, and Commercial Automobile
Liability) is the proportion of Net Premiums Written (NPW) in commercial long tail lines to total NPW.
Prop. of NPW from Personal Lines is the proportion of NPW in personal lines (Farmowners Multiple Peril,
Homeowners Multiple Peril, Personal Automobile Physical Damage and Personal Automobile Liability) to
total NPW. Reinsurance Usage is the percentage of gross premiums written ceded to reinsurers. Growth
in Net Premiums Written is the one year percentage change in net premiums written. Group Affiliation is
an indicator variable equal to one for insurers that are associated with a group, and zero otherwise. All
continuous variables are winsorized at the 1 and 99 percentiles to remove the excess effects of outliers.
Panel B presents comparisons between Healthy and Weak firms using t-tests for means and Wilcoxon
rank sum tests for medians. The Weak Firm subsample has 1,546 (573) observations while the Healthy
firm subsample has 5,909 (2,249) observations for the full (PSM) sample. *, **, and *** indicate statistical
significance at the 10%, 5%, and 1% level, respectively.
116