
Page 111 - 33-3
P. 111
NTU Management Review Vol. 33 No. 3 Dec. 2023
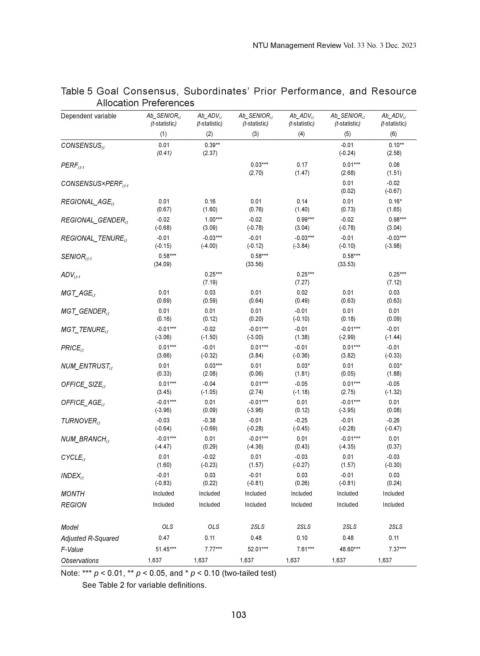
Table 5 Goal Consensus, Subordinates’ Prior Performance, and Resource
Allocation Preferences
Dependent variable Ab_SENIOR i,t Ab_ADV i,t Ab_SENIOR i,t Ab_ADV i,t Ab_SENIOR i,t Ab_ADV i,t
(t-statistic) (t-statistic) (t-statistic) (t-statistic) (t-statistic) (t-statistic)
(1) (2) (3) (4) (5) (6)
0.01 0.39** -0.01 0.10**
CONSENSUS i,t
(0.41) (2.37) (-0.24) (2.58)
0.03*** 0.17 0.01*** 0.08
PERF i,t-1
(2.70) (1.47) (2.68) (1.51)
0.01 -0.02
CONSENSUS×PERF i,t-1
(0.02) (-0.67)
0.01 0.16 0.01 0.14 0.01 0.16*
REGIONAL_AGE i,t
(0.67) (1.60) (0.76) (1.40) (0.73) (1.65)
-0.02 1.00*** -0.02 0.99*** -0.02 0.98***
REGIONAL_GENDER i,t
(-0.68) (3.09) (-0.78) (3.04) (-0.78) (3.04)
-0.01 -0.03*** -0.01 -0.03*** -0.01 -0.03***
REGIONAL_TENURE i,t
(-0.15) (-4.00) (-0.12) (-3.84) (-0.10) (-3.98)
0.58*** 0.58*** 0.58***
SENIOR i,t-1
(34.09) (33.56) (33.53)
0.25*** 0.25*** 0.25***
ADV i,t-1
(7.19) (7.27) (7.12)
0.01 0.03 0.01 0.02 0.01 0.03
MGT_AGE i,t
(0.69) (0.59) (0.64) (0.49) (0.63) (0.63)
0.01 0.01 0.01 -0.01 0.01 0.01
MGT_GENDER i,t
(0.16) (0.12) (0.20) (-0.10) (0.18) (0.09)
-0.01*** -0.02 -0.01*** -0.01 -0.01*** -0.01
MGT_TENURE i,t
(-3.06) (-1.50) (-3.00) (1.38) (-2.99) (-1.44)
0.01*** -0.01 0.01*** -0.01 0.01*** -0.01
PRICE i,t
(3.66) (-0.32) (3.84) (-0.36) (3.82) (-0.33)
0.01 0.03*** 0.01 0.03* 0.01 0.03*
NUM_ENTRUST i,t
(0.33) (2.08) (0.06) (1.81) (0.05) (1.88)
0.01*** -0.04 0.01*** -0.05 0.01*** -0.05
OFFICE_SIZE i,t
(3.45) (-1.05) (2.74) (-1.18) (2.75) (-1.32)
-0.01*** 0.01 -0.01*** 0.01 -0.01*** 0.01
OFFICE_AGE i,t
(-3.96) (0.09) (-3.96) (0.12) (-3.95) (0.08)
-0.03 -0.38 -0.01 -0.25 -0.01 -0.26
TURNOVER i,t
(-0.64) (-0.69) (-0.28) (-0.45) (-0.28) (-0.47)
-0.01*** 0.01 -0.01*** 0.01 -0.01*** 0.01
NUM_BRANCH i,t
(-4.47) (0.29) (-4.36) (0.43) (-4.35) (0.37)
0.01 -0.02 0.01 -0.03 0.01 -0.03
CYCLE i,t
(1.60) (-0.23) (1.57) (-0.27) (1.57) (-0.30)
-0.01 0.03 -0.01 0.03 -0.01 0.03
INDEX i,t
(-0.83) (0.22) (-0.81) (0.26) (-0.81) (0.24)
MONTH Included Included Included Included Included Included
REGION Included Included Included Included Included Included
Model OLS OLS 2SLS 2SLS 2SLS 2SLS
Adjusted R-Squared 0.47 0.11 0.48 0.10 0.48 0.11
F-Value 51.45*** 7.77*** 52.01*** 7.61*** 48.60*** 7.37***
Observations 1,637 1,637 1,637 1,637 1,637 1,637
Note: *** p < 0.01, ** p < 0.05, and * p < 0.10 (two-tailed test)
See Table 2 for variable definitions.
103