
Page 108 - 33-3
P. 108
Goal Consensus, Subordinates’ Prior Performances, and Supervisors’ Resource Allocation Preferences
-0.14*** -0.14*** -0.05* -0.02 -0.04* -0.01 0.01 -0.01 -0.06** -0.17*** -0.21*** -0.23*** 0.02 -0.13*** -0.03 1.00
21. 0.21*** 0.14*** 0.08*** 0.15*** 0.12***
0.06*** -0.01 0.04* -0.06** 0.18*** -0.01 -0.17*** 0.04 -0.02 0.01 0.01 0.06*** 0.17*** 0.05** -0.02 -0.18*** 0.10*** -0.05** -0.04 1.00 -0.02
20.
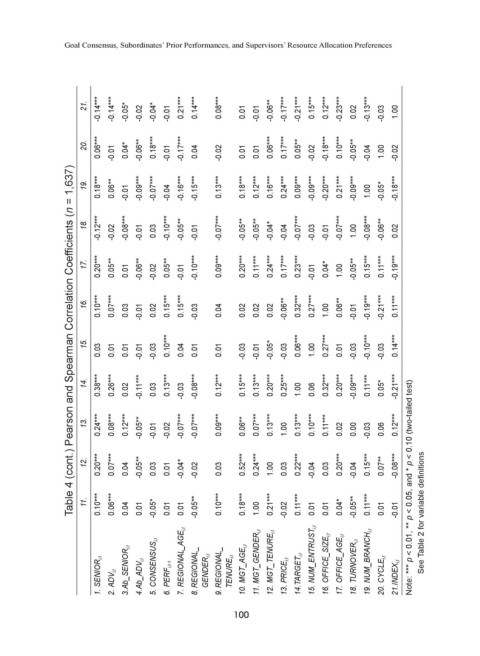
Table 4 (cont.) Pearson and Spearman Correlation Coefficients (n = 1,637)
0.18*** 0.06** -0.01 -0.09*** -0.07*** -0.04 -0.16*** -0.15*** 0.13*** 0.18*** 0.12*** 0.16*** 0.24*** 0.09*** -0.09*** -0.20*** 0.21*** -0.09*** 1.00 -0.05* -0.18***
19.
-0.12*** -0.02 -0.08*** -0.01 0.03 -0.10*** -0.05** -0.01 -0.07*** -0.05** -0.05** -0.04* -0.04 -0.07*** -0.03 -0.01 -0.07*** 1.00 -0.08*** -0.06** 0.02
18.
0.20*** 0.05** 0.01 -0.06** -0.02 0.05** -0.01 -0.10*** 0.09*** 0.20*** 0.11*** 0.24*** 0.17*** 0.23*** -0.01 0.04* 1.00 -0.05** 0.15*** 0.11*** -0.19***
17.
0.10*** 0.07*** 0.03 -0.01 0.02 0.15*** 0.15*** -0.03 0.04 0.02 0.02 0.02 -0.06** 0.32*** 0.27*** 1.00 0.06** -0.01 -0.19*** -0.21*** 0.11***
16.
15. 0.10*** 0.06*** 0.27*** -0.10*** 0.14***
0.03 0.01 0.01 -0.01 -0.03 0.04 0.01 0.01 -0.03 -0.01 -0.05* -0.03 1.00 0.01 -0.03 -0.03
0.38*** 0.26*** 0.02 -0.11*** 0.03 0.13*** -0.03 -0.08*** 0.12*** 0.15*** 0.13*** 0.20*** 0.25*** 1.00 0.06 0.32*** 0.20*** -0.09*** 0.11*** 0.05* -0.21***
14.
0.24*** 0.08*** 0.12*** -0.05** -0.01 -0.02 -0.07*** -0.07*** 0.09*** 0.06** 0.07*** 0.13*** 1.00 0.13*** 0.10*** 0.11*** 0.02 0.00 -0.03 0.06 0.12***
13.
0.20*** 0.07*** 0.04 -0.05** 0.03 0.01 -0.04* -0.02 0.03 0.52*** 0.24*** 1.00 0.03 0.22*** -0.04 0.03 0.20*** -0.04 0.15*** 0.07** -0.08***
12.
0.10*** 0.06*** 0.04 0.01 -0.05* 0.01 0.01 -0.05** 0.10*** 0.18*** 1.00 0.21*** -0.02 0.11*** 0.01 0.01 0.04* -0.05** 0.11*** 0.01 -0.01 See Table 2 for variable definitions
11. Note: *** p < 0.01, ** p < 0.05, and * p < 0.10 (two-tailed test)
1. SENIOR i,t 2. ADV i,t 3.Ab_SENIOR i,t 4.Ab_ADV i,t 5. CONSENSUS i,t 6. PERF i,t-1 7. REGIONAL_AGE i,t 8. REGIONAL_ GENDER i,t 9. REGIONAL_ TENURE i,t 10. MGT_AGE i,t 11. MGT_GENDER i,t 12. MGT_TENURE i,t 13. PRICE i,t 14.TARGET i,t 15. NUM_ENTRUST i,t 16. OFFICE_SIZE i,t 17. OFFICE_AGE i,t 18. TURNOVER i,t 19. NUM_BRANCH i,t 20. CYCLE i,t 21.INDEX i,t
100