Page 116 - 33-3
P. 116

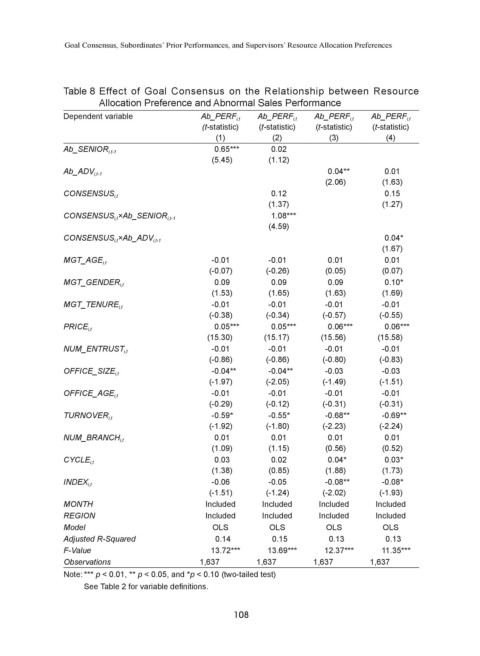
Goal Consensus, Subordinates’ Prior Performances, and Supervisors’ Resource Allocation Preferences


               Table 8 Effect of Goal Consensus on the Relationship between Resource
                       Allocation Preference and Abnormal Sales Performance
               Dependent variable             Ab_PERF i,t  Ab_PERF i,t  Ab_PERF i,t  Ab_PERF i,t
                                              (t-statistic)  (t-statistic)  (t-statistic)  (t-statistic)
                                                 (1)          (2)          (3)          (4)
                                                 0.65***      0.02
               Ab_SENIOR i,t-1
                                                (5.45)       (1.12)
                                                                           0.04**      0.01
               Ab_ADV i,t-1
                                                                          (2.06)       (1.63)
                                                              0.12                     0.15
               CONSENSUS i,t
                                                             (1.37)                    (1.27)
                                                              1.08***
               CONSENSUS i,t ×Ab_SENIOR i,t-1
                                                             (4.59)
                                                                                       0.04*
               CONSENSUS i,t ×Ab_ADV i,t-1
                                                                                       (1.67)
                                                -0.01        -0.01         0.01        0.01
               MGT_AGE i,t
                                                (-0.07)      (-0.26)      (0.05)       (0.07)
                                                 0.09         0.09         0.09        0.10*
               MGT_GENDER i,t
                                                (1.53)       (1.65)       (1.63)       (1.69)
                                                -0.01        -0.01        -0.01        -0.01
               MGT_TENURE i,t
                                                (-0.38)      (-0.34)     (-0.57)      (-0.55)
                                                 0.05***      0.05***      0.06***     0.06***
               PRICE i,t
                                               (15.30)      (15.17)      (15.56)      (15.58)
                                                -0.01        -0.01        -0.01        -0.01
               NUM_ENTRUST i,t
                                                (-0.86)      (-0.86)     (-0.80)      (-0.83)
                                                -0.04**      -0.04**      -0.03        -0.03
               OFFICE_SIZE i,t
                                                (-1.97)      (-2.05)     (-1.49)      (-1.51)
                                                -0.01        -0.01        -0.01        -0.01
               OFFICE_AGE i,t
                                                (-0.29)      (-0.12)     (-0.31)      (-0.31)
                                                -0.59*       -0.55*       -0.68**      -0.69**
               TURNOVER i,t
                                                (-1.92)      (-1.80)     (-2.23)      (-2.24)
                                                 0.01         0.01         0.01        0.01
               NUM_BRANCH i,t
                                                (1.09)       (1.15)       (0.56)       (0.52)
                                                 0.03         0.02         0.04*       0.03*
               CYCLE i,t
                                                (1.38)       (0.85)       (1.88)       (1.73)
                                                -0.06        -0.05        -0.08**      -0.08*
               INDEX i,t
                                                (-1.51)      (-1.24)     (-2.02)      (-1.93)
               MONTH                           Included     Included     Included    Included
               REGION                          Included     Included     Included    Included
               Model                             OLS         OLS          OLS          OLS
               Adjusted R-Squared                0.14         0.15         0.13         0.13
               F-Value                          13.72***     13.69***     12.37***     11.35***
               Observations                   1,637        1,637       1,637        1,637
               Note: *** p < 0.01, ** p < 0.05, and *p < 0.10 (two-tailed test)
                    See Table 2 for variable definitions.


                                                     108
   111   112   113   114   115   116   117   118   119   120   121