


 258 /302

顧客與供應商關係與成本結構
258
customers to set up system to exchange their information such as demand forecast (Ren,
Cohen, Ho, and Terwiesch, 2010). Enhanced information exchange enables suppliers to
make a better decision whether to retain resources when sales decrease, mitigating cost
stickiness.
As the link between cost stickiness and customer concentration is unclear, we state
our hypothesis in null form:
H1: There is no association between cost stickiness and customer concentration
4. Research Design and Sample Selection
4.1 Measure of Customer Concentration
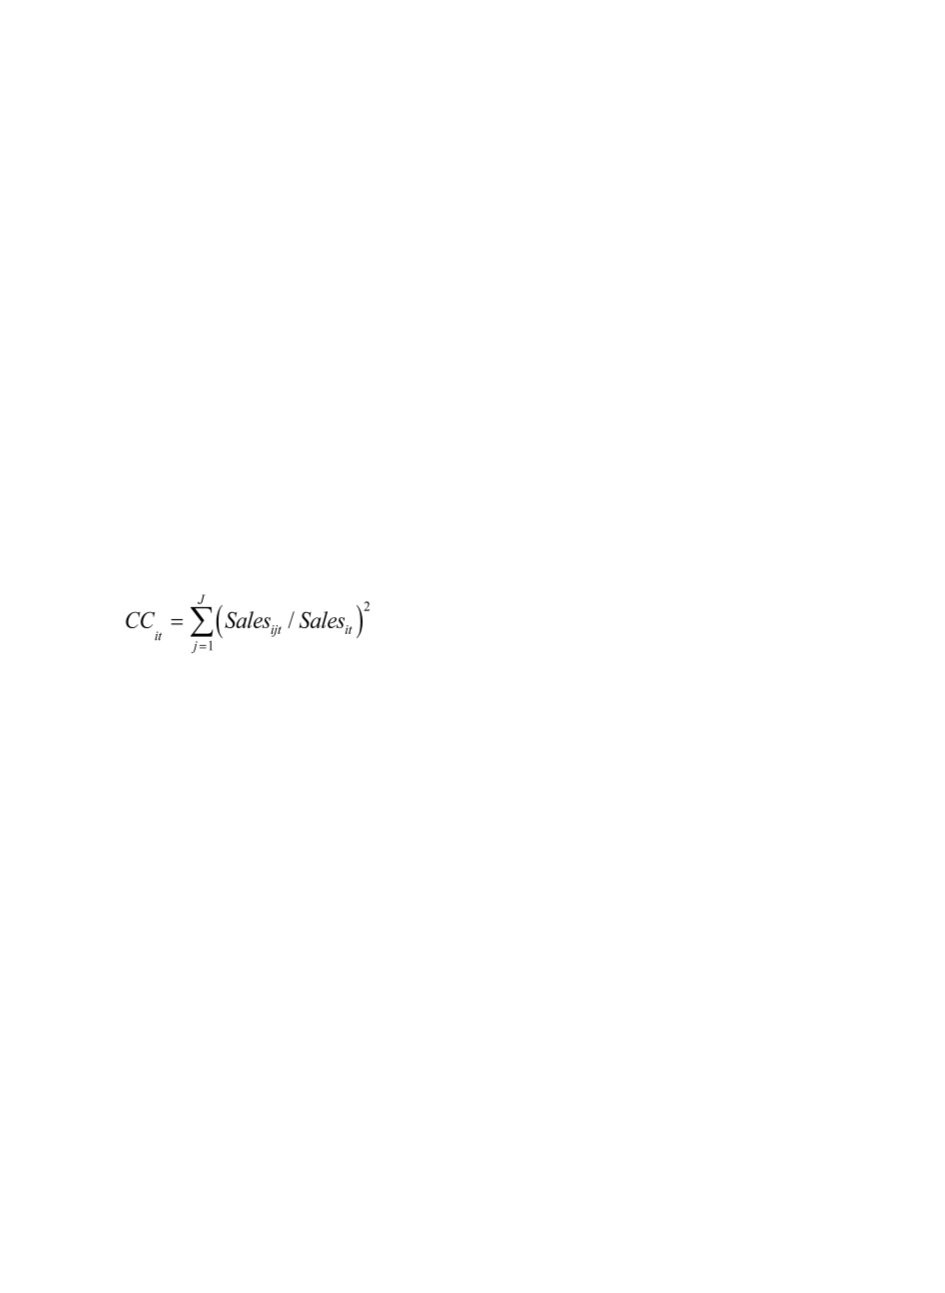
To capture the extent to which a supplier’s customer base is concentrated, we create
variable of customer concentration. Following Patatoukas (2012), we create our primary
measure of customer concentration (
CC
) using the following formula:
(2)
where
Sales
ijt
represents firm
i
’s sales to customer
j
in year
t
and
Sales
it
represents
total sales for firm
i
in year
t
. Patatoukas (2012) implements Herfindahl-Hirschman index
to construct the measure of
CC
. The measure
CC
captures two elements of customer
concentration: the number of major customer with which the firm interacts and the relative
importance of each major customer in the firm’s annual sales.
CC
ranges from 0 to 1, with
higher value indicates suppliers with more concentrated customer bases and vice versa.
4.2 Research Model
Following the methodology proposed by Banker and Byzalov (2014), we investigate
the association between customer concentration and cost stickiness using the regression of
the following form: