


 201 / 330

臺大管理論叢
第
27
卷第
2
期
201
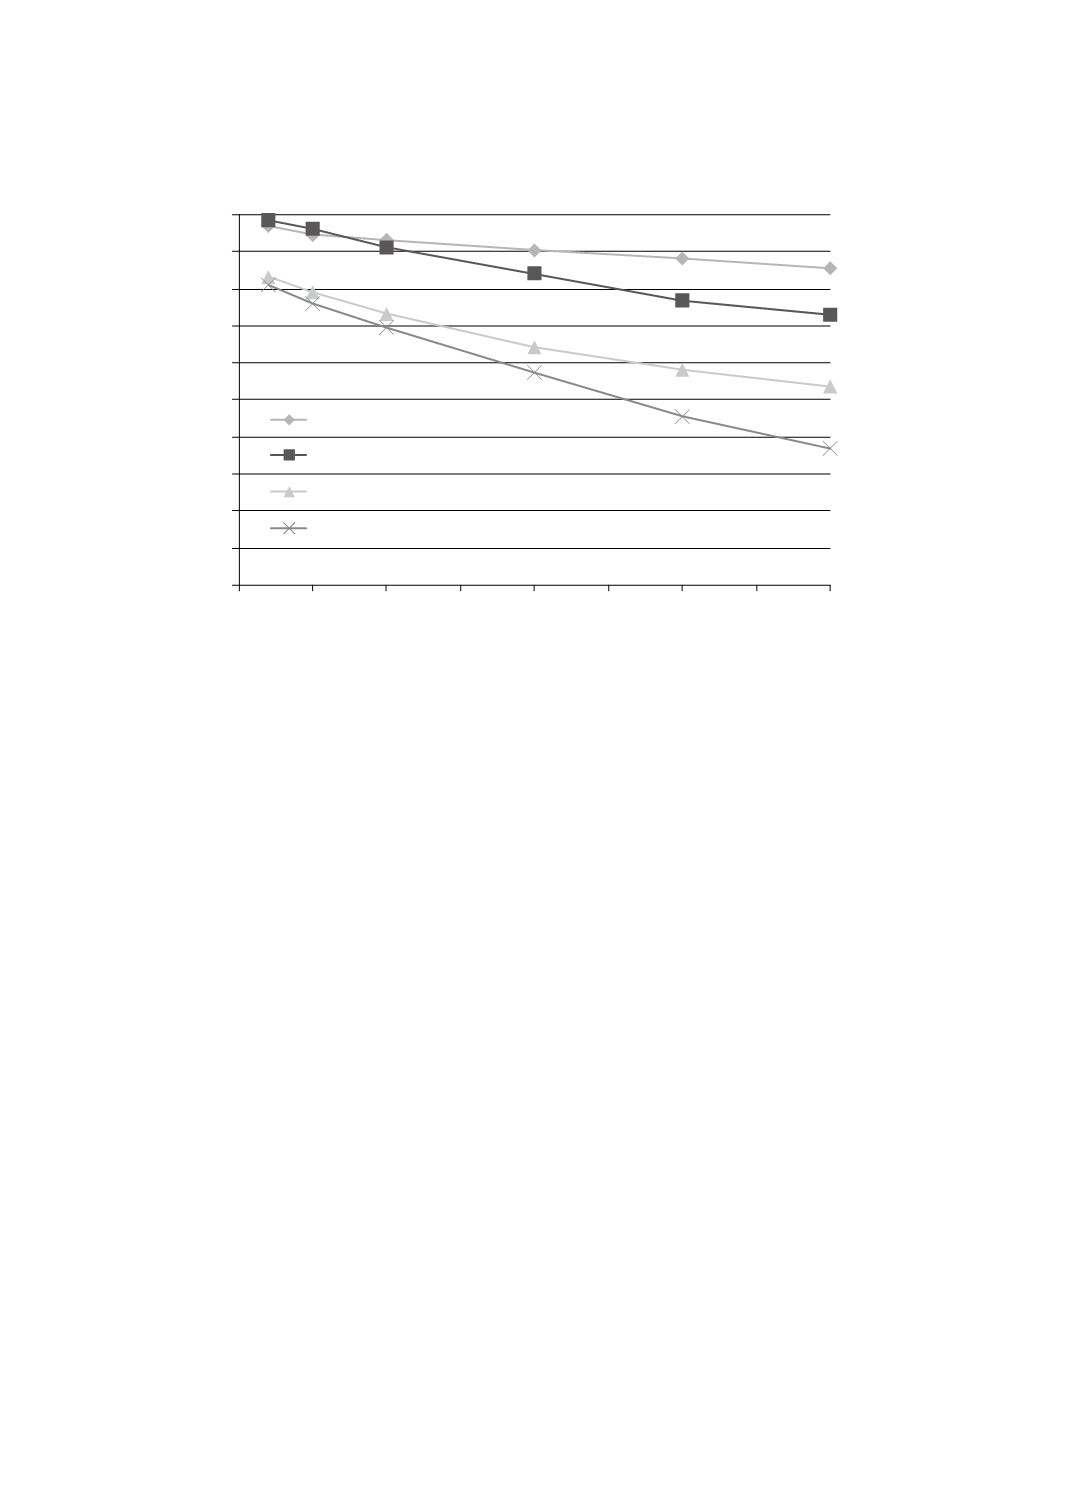
Figure 3 depicts the utilities of suppliers for different risk-taking behaviors under
Scenario iii (market demand is decreasing). As can be seen, when market demand is
decreasing, risk-neutral and risk-averse buyers would select supplier B, while risk-seeking
buyers (risk aversion factor
r
> 1.25) would choose supplier A. Compared with the results
shown in Figure 1 for Scenario i, those shown in Figure 3 for Scenario ii reveal decreasing
difference in utility between supplier A and supplier B. In this case study, the inventory cost
of supplier B is smaller than that of supplier A. The results shown in Figure 3 indicate that
when market demand is decreasing, risk-averse buyers may lower their forecasts and select
suppliers with lower inventory costs (to avoid further losses), whereas risk-seeking and risk-
neutral buyers may or may not switch suppliers.
0
0.1
0.2
0.3
0.4
0.5
0.6
0.7
0.8
0.9
1
0
0.25
0.5 0.75
1
1.25
1.5 1.75
2
UTILITY
RISK AVERSION FACTOR
Supplier A
Supplier B
Supplier C
Supplier D
Figure 2 Utilities of Suppliers When Market Demand is Increasing