


 200 / 330

考量買方風險接受態度的供應商選擇:結合效用函數的簡單多屬性評比方法
200
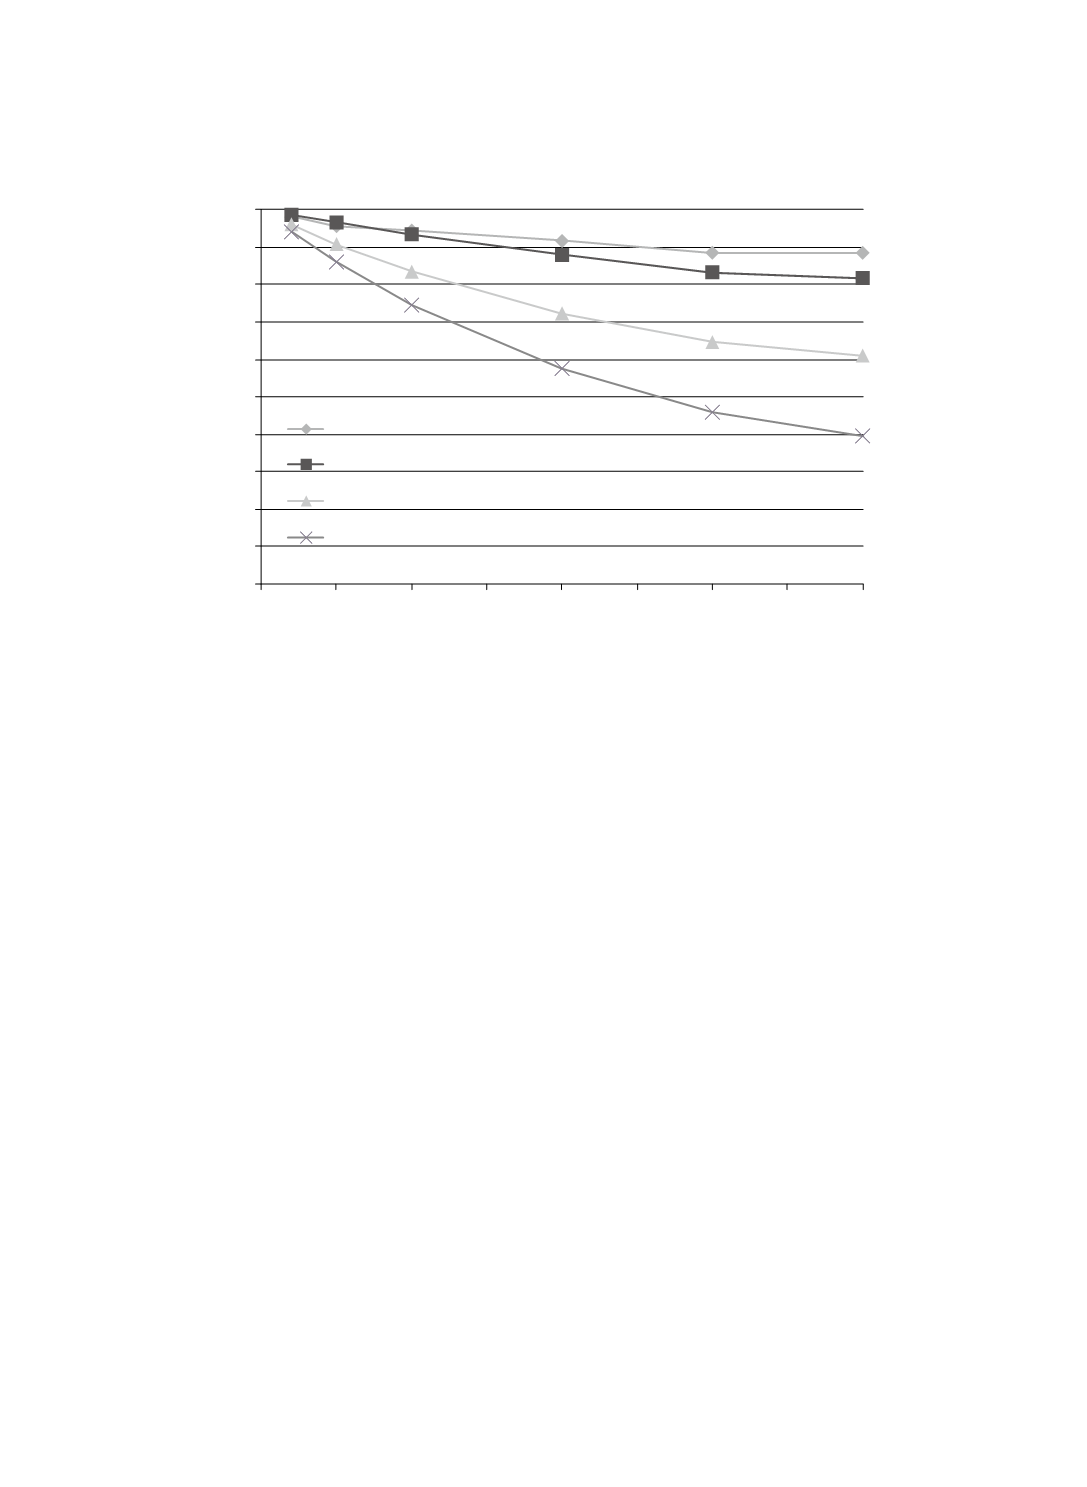
Figure 2 depicts the utilities of suppliers for different risk-taking behaviors under
Scenario ii (market demand is increasing). As can be seen, when market demand is growing,
most of the buyers (risk-neutral, risk-seeking, or risk-averse) would select supplier A, while
very conservative buyers (risk aversion factor
r
< 0.25) would still choose supplier B.
Compared with the results shown in Figure 1 for Scenario i, those seen in Figure 2 for
Scenario ii reveal increasing difference in utility between supplier A and supplier B when
r
increases. In this case study, supplier A has larger manufacture capacity and order flexibility
than supplier B. The result indicates that when market demand is (or expected to be)
increasing, risk-seeking buyers (manufacturers) may be more inclined to enlarge their
forecasts and use suppliers with larger capacities and/or flexibilities, whereas risk-averse and
risk-neutral buyers may or may not be willing to adjust their forecasts and change suppliers.
0
0.1
0.2
0.3
0.4
0.5
0.6
0.7
0.8
0.9
1
0
0.25
0.5
0.75
1
1.25
1.5
1.75
2
UTILITY
RISK AVERSION FACTOR
Supplier A
Supplier B
Supplier C
Supplier D
Figure 1 Utilities of Suppliers When Market Demand Remains Stable