
臺大管理論叢
第
27
卷第
1
期
375
in Table 1, yields a final sample of 5,259 observations. Financial statement data are from
Compustat, internal governance and audit committee and director compensation data are
from ExecuComp, stock return data are from CRSP, and external governance data are from I/
B/E/S and Thomson Reuters.
Table 1 Sample Selection Procedure
Firm-Year
Initial Sample from ExecuComp for 2006-2012
13,245
Missing GMI Ratings Data
(1,482)
Financial Firms
(2,486)
Utilities
(1,250)
Government Sectors
(34)
Missing Value in Variables
(2,734)
Final Sample
5,259
4.2 Variable Definition
4.2.1 Proxy for Agency Conflict (
FREE_TOBIN
)
We follow Liang, Stulz, and Walkling (1991), Doukas, Kim, and Pantzalis (2000), and
McKnight and Weir (2009) and use the interaction between the company’s free cash flow
and its growth opportunity (Tobin’s Q) to proxy for agency conflict. Agency conflict exists
when managers have the incentives and the ability to engage in activities that maximize their
own utility at the cost of shareholders. Free cash flow is cash flow in excess of cash that is
required to fund all projects that have positive net present values when discounted at the
relevant cost of capital. Jensen (1986) claims that conflicts are especially severe when
substantial free cash flow is generated in the organization, since the manager has more power
over using the cash. Agency conflicts grow when shareholders have to find a way to
motivate managers to disgorge the cash rather than waste it on organization inefficiencies or
invest it below the cost of capital (Lehn and Poulsen, 1989). In our study, free cash flows are
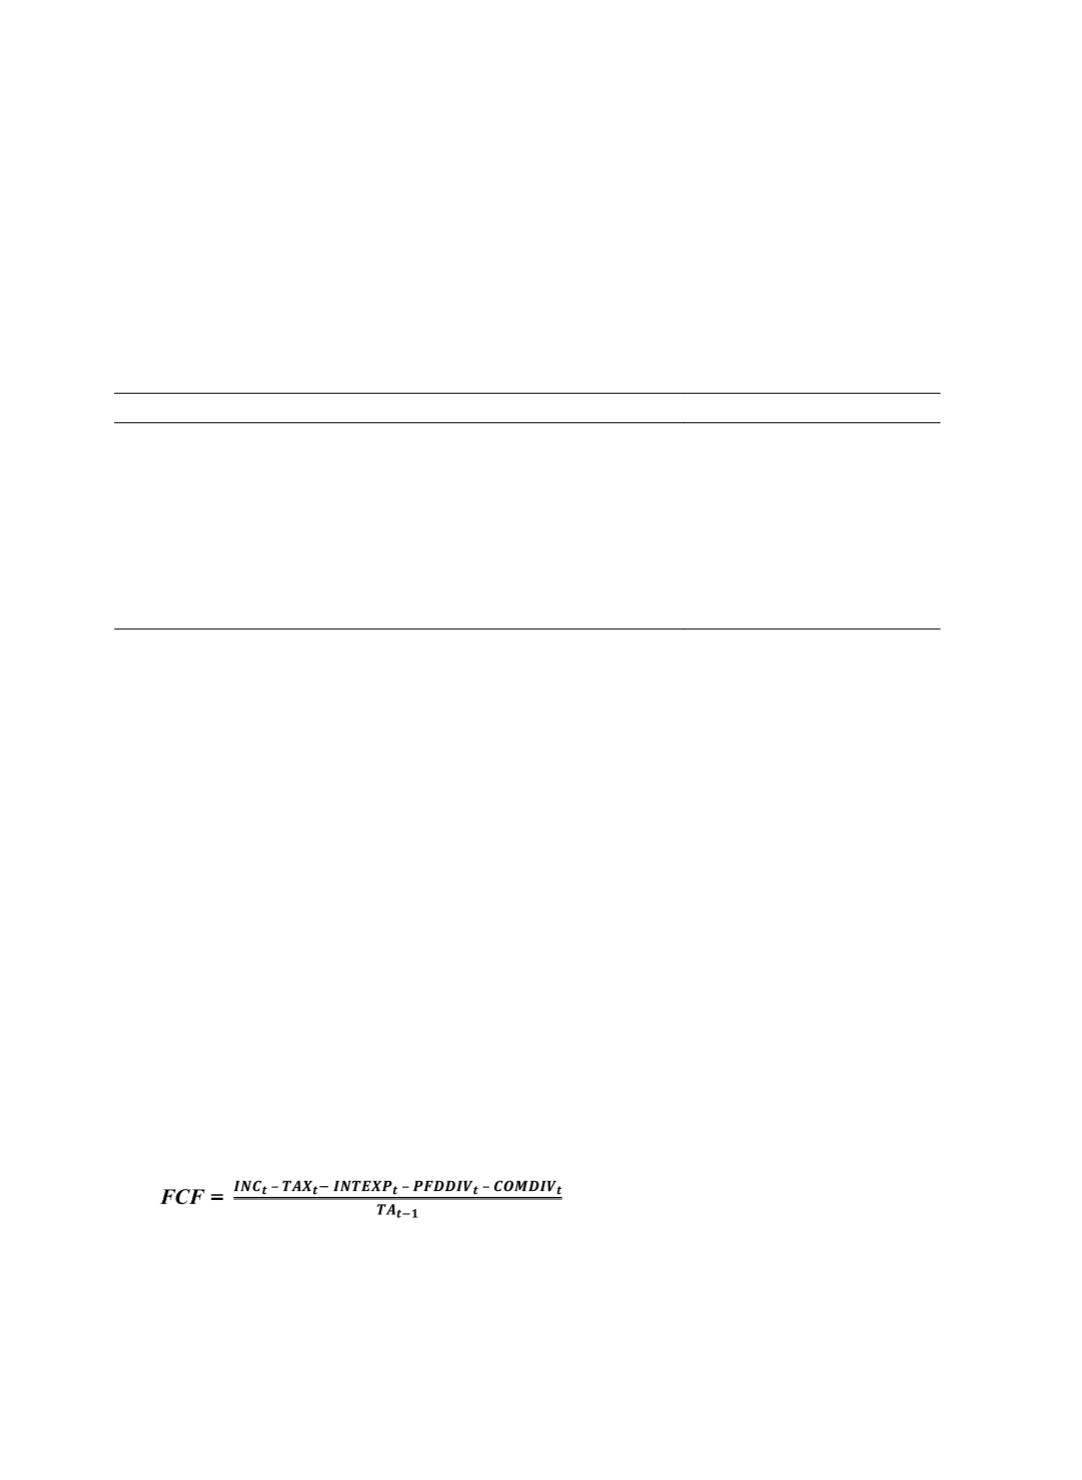
calculated by the equation below, based on the definition of Lehn and Poulsen (1989):
(1)
where
INC
t
= operating income before depreciation (Compustat data item
OIBDP
)


