


 51 /342

臺大管理論叢
第
27
卷第
2S
期
51
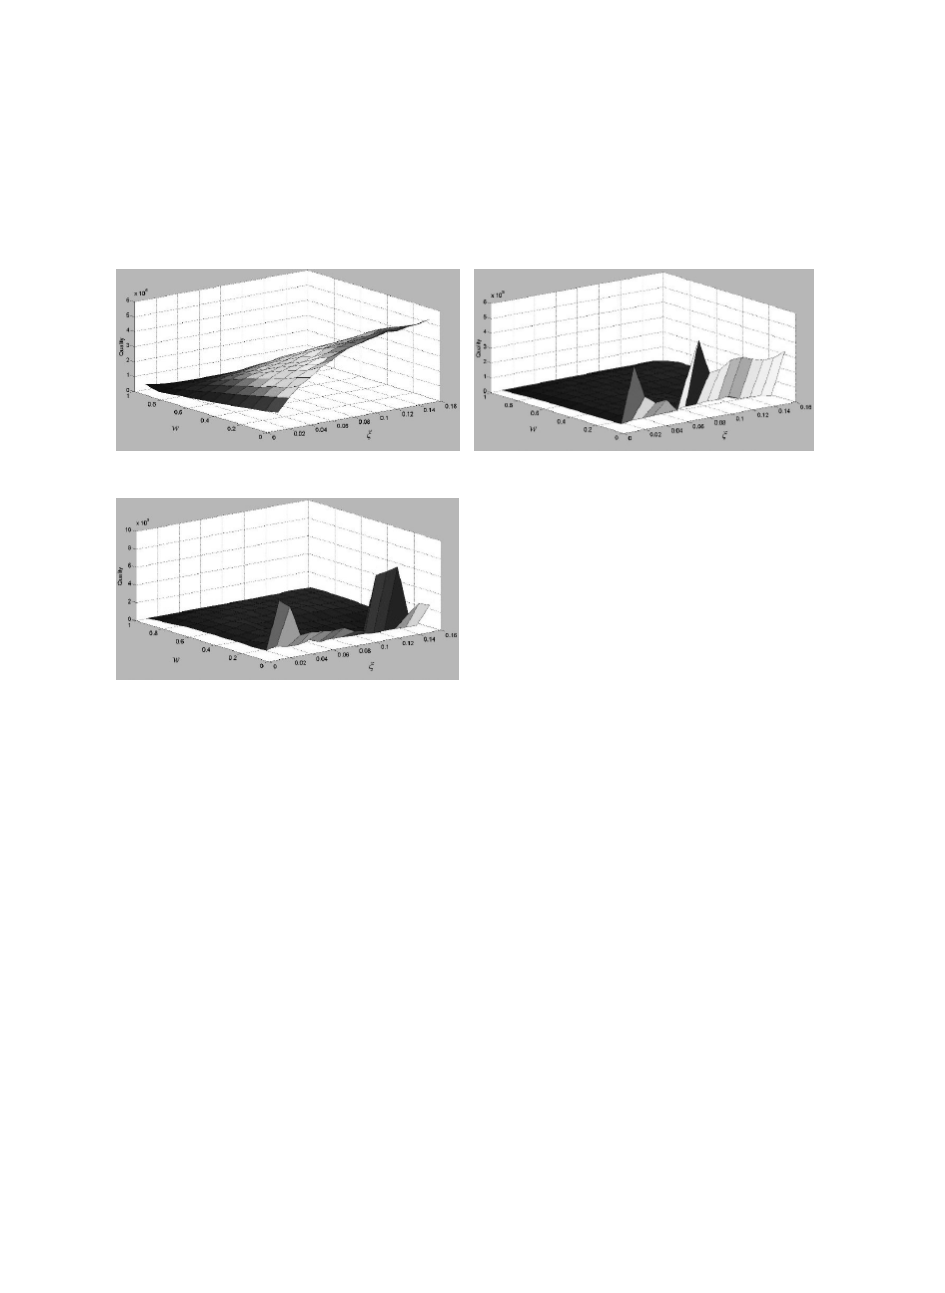
clusters under various parameter settings, where the z axis stands for average number of
clusters.
(a)
(c)
(b)
Figure 4 Summarization Quality in the Three Datasets: (a) Synthetic Dataset; (b)
DY2009 Dataset; (c) AirQuality Dataset
For the synthetic dataset, higher w and lower
ξ
lead to better summarization quality. The
FU2Ps derived from the synthetic dataset have similar appearance and cover a wide range of
expected supports. A higher
w
leads to that the FU2Ps in a cluster have similar expected
supports. Because the FU2Ps already have similar appearance, a higher w and a lower
ξ
deliver good summarization quality. For the two real datasets, the summarization quality is
consistently good under most parameter settings, except for those with zero
w
. The FU2Ps in
each real dataset are slightly more similar in expected support than in appearance. Setting w
to zero only considers appearance similarity; while the resulting clusters may have FU2Ps
with similar appearance, the expected supports of the FU2Ps in a cluster may still be
significantly different. Therefore the summarization quality is bad.