


 50 /342

為頻繁單變量不確定樣式產生摘要
50
explore the performance of the SFC algorithm under different parameters, we set
w
from 0 to
1.0 at an interval of 0.1,
ξ
from 0.01 to 0.15 at an interval of 0.01, and
δ
from 1.0 to 3.0 at an
interval of 0.05. These parameters are set by experience. The
summarization quality
and
runtime of each setting are reported in Figs. 10 and 11. The summarization quality is affected
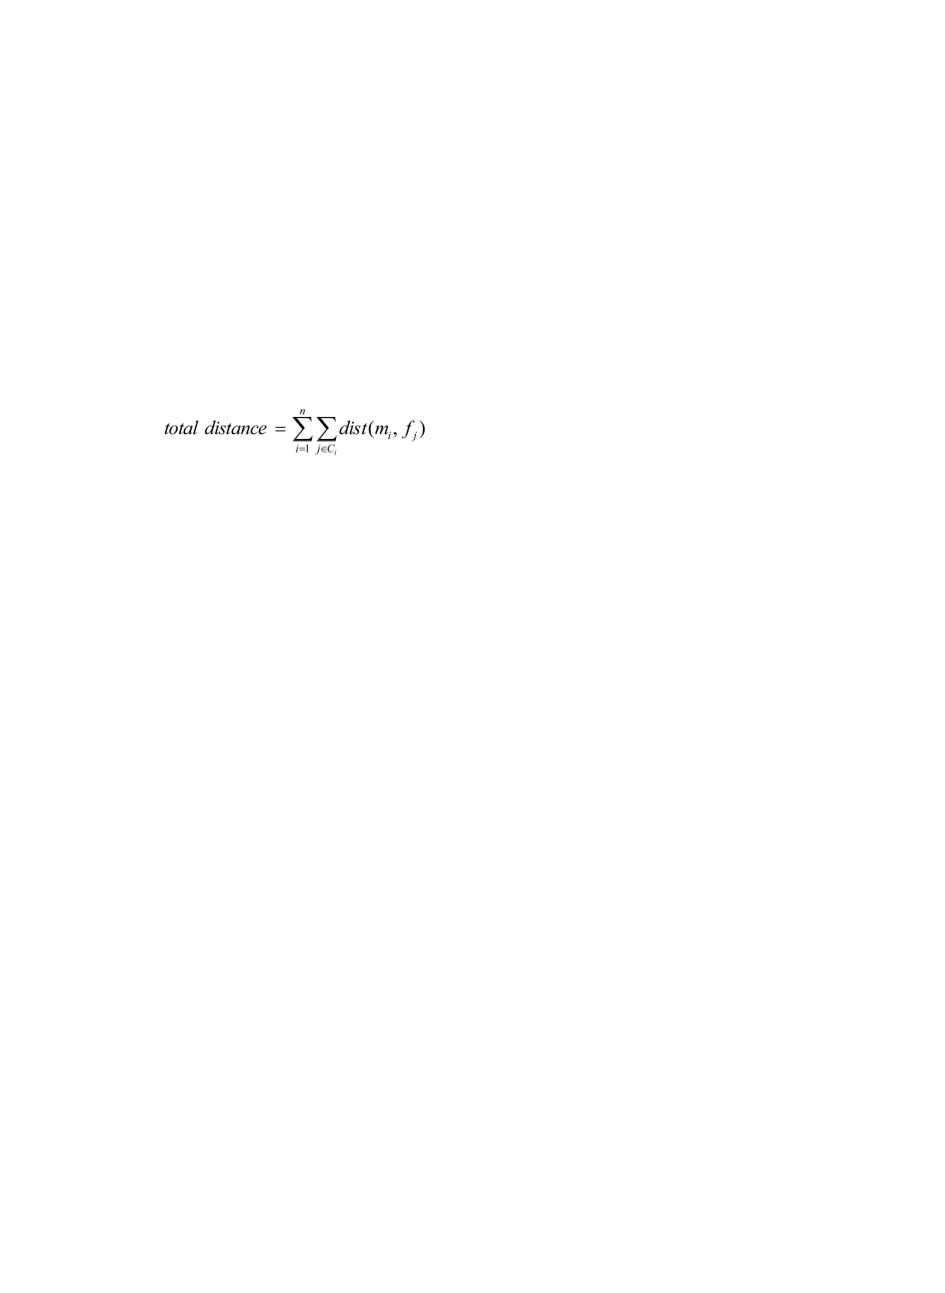
by two factors. The first factor is the
total distance
, which is the summation of the distances
between the medoid and the FUPs in each cluster. The second factor is the number of
clusters. We formally define the total distance as equation (7):
(7)
In equation (7),
n
is the number of clusters,
m
i
is the medoid of cluster
C
i
, and
f
j
represents
j
th
FU2P belonging to cluster
C
i
.
dist
(
.
,
.
) returns the distance between two
FU2Ps, which is defined in equation (4). A lower total distance implies a better clustering
result. However, a lower total distance may result from a high number of clusters. Since we
also prefer a low number of clusters, we define a quality index as equation (8). Therefore, a
lower quality index indicates a better summarization quality.
quality index = total distance × number of clusters
(8)
In the experiments, we set minimum support to 0.013 for the synthetic dataset and 0.03
for the two real datasets. We found that the quality indices derived by using a fixed
w
and a
fixed
ξ
but various
δ
do not change significantly. This is because not many clusters were
merged in the process. In fact, most attempts failed due to the negative silhouette criterion
(i.e. there exists no FU2P with a negative silhouette in the merged cluster). The runtimes
derived also present similar results. Figures 4(a), 4(b), and 4(c) show the quality index under
various parameter settings in the three datasets, respectively. In the figures, the x axis and y
axis indicate different values of
ξ
and
w
, respectively. Because the quality indices derived by
using different values of
δ
do not vary very much at the same level of
ξ
and
w
, the z axis
presents the average quality index derived by averaging the quality indices at the same level
of
ξ
and
w
. Figures 5(a), 5(b), and 5(c) show the runtimes required for generating summary
from FU2Ps under various parameter settings in the three datasets, respectively, where the z
axis presents average runtimes. In Figs. 6(a), 6(b), and 6(c), we present the number of