
Page 152 - 33-3
P. 152
Understanding People's Switching Intentions of Health Apps from Exterior and Interior Drivers
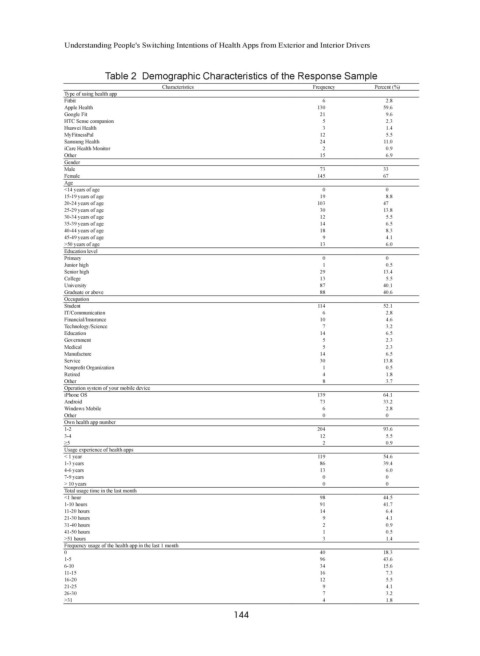
Table 2 Demographic Characteristics of the Response Sample
Characteristics Frequency Percent (%)
Type of using health app
Fitbit 6 2.8
Apple Health 130 59.6
Google Fit 21 9.6
HTC Sense companion 5 2.3
Huawei Health 3 1.4
MyFitnessPal 12 5.5
Samsung Health 24 11.0
iCare Health Monitor 2 0.9
Other 15 6.9
Gender
Male 73 33
Female 145 67
Age
<14 years of age 0 0
15-19 years of age 19 8.8
20-24 years of age 103 47
25-29 years of age 30 13.8
30-34 years of age 12 5.5
35-39 years of age 14 6.5
40-44 years of age 18 8.3
45-49 years of age 9 4.1
>50 years of age 13 6.0
Education level
Primary 0 0
Junior high 1 0.5
Senior high 29 13.4
College 13 5.5
University 87 40.1
Graduate or above 88 40.6
Occupation
Student 114 52.1
IT/Communication 6 2.8
Financial/Insurance 10 4.6
Technology/Science 7 3.2
Education 14 6.5
Government 5 2.3
Medical 5 2.3
Manufacture 14 6.5
Service 30 13.8
Nonprofit Organization 1 0.5
Retired 4 1.8
Other 8 3.7
Operation system of your mobile device
iPhone OS 139 64.1
Android 73 33.2
Windows Mobile 6 2.8
Other 0 0
Own health app number
1-2 204 93.6
3-4 12 5.5
≥5 2 0.9
Usage experience of health apps
< 1 year 119 54.6
1-3 years 86 39.4
4-6 years 13 6.0
7-9 years 0 0
> 10 years 0 0
Total usage time in the last month
<1 hour 98 44.5
1-10 hours 91 41.7
11-20 hours 14 6.4
21-30 hours 9 4.1
31-40 hours 2 0.9
41-50 hours 1 0.5
>51 hours 3 1.4
Frequency usage of the health app in the last 1 month
0 40 18.3
1-5 96 43.6
6-10 34 15.6
11-15 16 7.3
16-20 12 5.5
21-25 9 4.1
26-30 7 3.2
>31 4 1.8
144