
Page 156 - 33-3
P. 156
Understanding People's Switching Intentions of Health Apps from Exterior and Interior Drivers
2
R values. The path coefficient represents the direct effect, i.e., the strength and direction
2
of the relationship between variables, and higher values have a greater effect. The R
value is the explanatory power of the structural model and can explain and predict the
percentage of the independent variance of the relevant variance. In order to obtain the path
2
coefficient and the R value, this study first executes the PLS algorithm, and then executes
the bootstrapping algorithm to check whether the path coefficient is significant. The t-value
is demonstrated on the path. If the t-value is greater than 2.57, it means that the significant
level is 1% (p < 0.01); if the t-value is greater than 1.96, it means that the significant level
is 5% (p < 0.05), which is the commonly used standard (usually t-value being greater than
1.96 is called significant); if the t-value is greater than 1.65, it means that the significant
level is 10% (p < 0.1), which is less obviously significant.
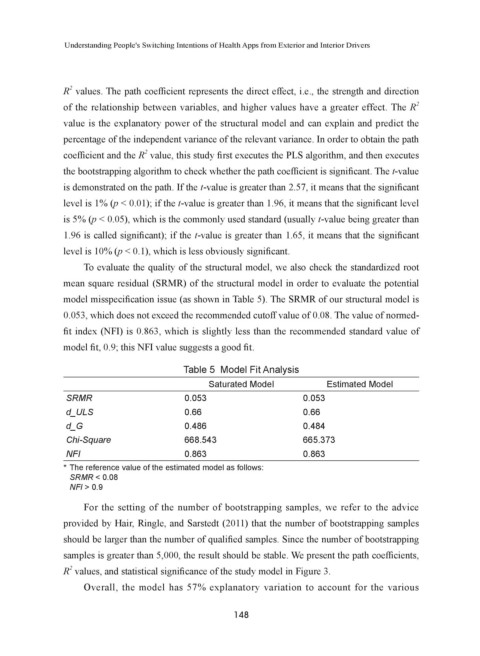
To evaluate the quality of the structural model, we also check the standardized root
mean square residual (SRMR) of the structural model in order to evaluate the potential
model misspecification issue (as shown in Table 5). The SRMR of our structural model is
0.053, which does not exceed the recommended cutoff value of 0.08. The value of normed-
fit index (NFI) is 0.863, which is slightly less than the recommended standard value of
model fit, 0.9; this NFI value suggests a good fit.
Table 5 Model Fit Analysis
Saturated Model Estimated Model
SRMR 0.053 0.053
d_ULS 0.66 0.66
d_G 0.486 0.484
Chi-Square 668.543 665.373
NFI 0.863 0.863
* The reference value of the estimated model as follows:
SRMR < 0.08
NFI > 0.9
For the setting of the number of bootstrapping samples, we refer to the advice
provided by Hair, Ringle, and Sarstedt (2011) that the number of bootstrapping samples
should be larger than the number of qualified samples. Since the number of bootstrapping
samples is greater than 5,000, the result should be stable. We present the path coefficients,
2
R values, and statistical significance of the study model in Figure 3.
Overall, the model has 57% explanatory variation to account for the various
148