
Page 103 - 33-3
P. 103
NTU Management Review Vol. 33 No. 3 Dec. 2023
Ab_SENIOR i,t = γ + γ CONSENSUS + γ REGIONAL_GENDER + γ REGIONAL_
i,t
i,t
0
1
3
2
AGE + γ REGIONAL_TENURE + γ SENIOR i,t-1 + γ MGT_AGE i,t
6
5
4
i,t
i,t
+ γ MGT_GENDER + γ MGT_TENURE + γ PRICE + γ NUM_
10
9
8
i,t
i,t
7
i,t
ENTRUST + γ OFFICE_SIZE + γ OFFICE_AGE + γ TURN i,t
i,t
13
12
11
i,t
i,t
+ γ NUM_BRANCH + γ CYCLE + γ INDEX + ∑MONTH +
i,t
i,t
i,t
15
14
16
∑REGION + μ , (3)
i,t
Ab_ADV = α + α CONSENSUS + α REGIONAL_GENDER + α REGIONAL_
1
i,t
i,t
3
0
i,t
2
AGE + α REGIONAL_TENURE + α ADV i,t-1 + α MGT_AGE +
5
i,t
6
4
i,t
i,t
α MGT_GENDER + α MGT_TENURE + α PRICE + α NUM_
10
i,t
i,t
9
8
i,t
7
ENTRUST + α OFFICE_SIZE + α OFFICE_AGE + α TURN i,t
i,t
i,t
13
12
i,t
11
+ α NUM_BRANCH + α CYCLE + α INDEX +∑MONTH
i,t
16
i,t
15
i,t
14
+∑REGION + φ . (4)
i,t
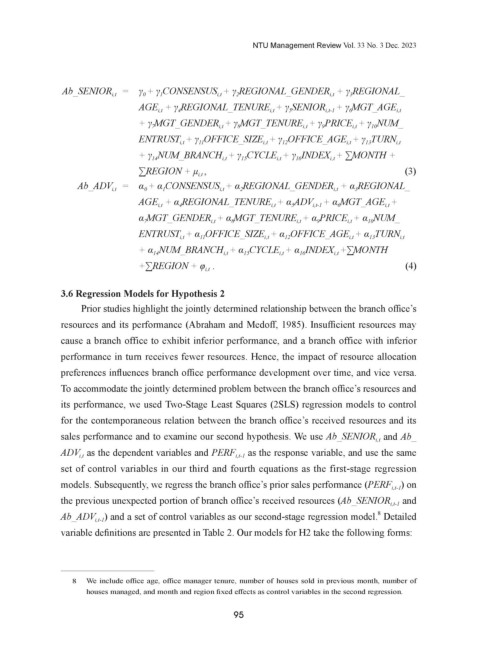
3.6 Regression Models for Hypothesis 2
Prior studies highlight the jointly determined relationship between the branch office’s
resources and its performance (Abraham and Medoff, 1985). Insufficient resources may
cause a branch office to exhibit inferior performance, and a branch office with inferior
performance in turn receives fewer resources. Hence, the impact of resource allocation
preferences influences branch office performance development over time, and vice versa.
To accommodate the jointly determined problem between the branch office’s resources and
its performance, we used Two-Stage Least Squares (2SLS) regression models to control
for the contemporaneous relation between the branch office’s received resources and its
sales performance and to examine our second hypothesis. We use Ab_SENIOR and Ab_
i,t
ADV as the dependent variables and PERF as the response variable, and use the same
i,t-1
i,t
set of control variables in our third and fourth equations as the first-stage regression
models. Subsequently, we regress the branch office’s prior sales performance (PERF ) on
i,t-1
the previous unexpected portion of branch office’s received resources (Ab_SENIOR and
i,t-1
8
Ab_ADV ) and a set of control variables as our second-stage regression model. Detailed
i,t-1
variable definitions are presented in Table 2. Our models for H2 take the following forms:
8 We include office age, office manager tenure, number of houses sold in previous month, number of
houses managed, and month and region fixed effects as control variables in the second regression.
95