
Page 113 - 33-2
P. 113
NTU Management Review Vol. 33 No. 2 Aug. 2023
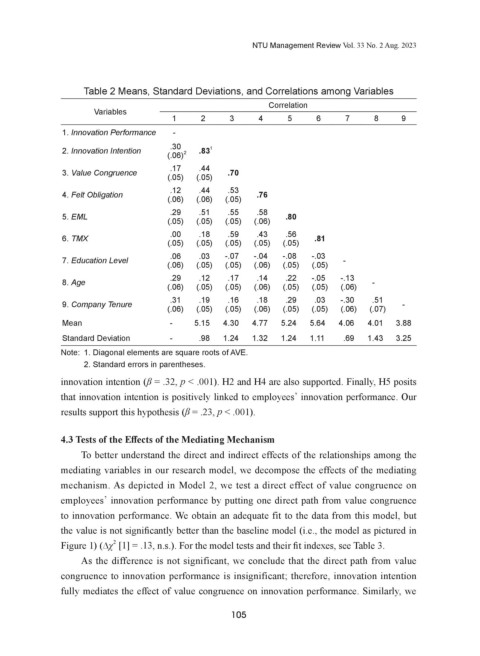
Table 2 Means, Standard Deviations, and Correlations among Variables
Correlation
Variables
1 2 3 4 5 6 7 8 9
1. Innovation Performance -
.30
2. Innovation Intention .83 1
(.06) 2
.17 .44
3. Value Congruence .70
(.05) (.05)
.12 .44 .53
4. Felt Obligation (.06) (.06) (.05) .76
.29 .51 .55 .58
5. EML .80
(.05) (.05) (.05) (.06)
.00 .18 .59 .43 .56
6. TMX .81
(.05) (.05) (.05) (.05) (.05)
.06 .03 -.07 -.04 -.08 -.03
7. Education Level (.06) (.05) (.05) (.06) (.05) (.05) -
.29 .12 .17 .14 .22 -.05 -.13
8. Age -
(.06) (.05) (.05) (.06) (.05) (.05) (.06)
.31 .19 .16 .18 .29 .03 -.30 .51
9. Company Tenure -
(.06) (.05) (.05) (.06) (.05) (.05) (.06) (.07)
Mean - 5.15 4.30 4.77 5.24 5.64 4.06 4.01 3.88
Standard Deviation - .98 1.24 1.32 1.24 1.11 .69 1.43 3.25
Note: 1. Diagonal elements are square roots of AVE.
2. Standard errors in parentheses.
innovation intention (β = .32, p < .001). H2 and H4 are also supported. Finally, H5 posits
that innovation intention is positively linked to employees’ innovation performance. Our
results support this hypothesis (β = .23, p < .001).
4.3 Tests of the Effects of the Mediating Mechanism
To better understand the direct and indirect effects of the relationships among the
mediating variables in our research model, we decompose the effects of the mediating
mechanism. As depicted in Model 2, we test a direct effect of value congruence on
employees’ innovation performance by putting one direct path from value congruence
to innovation performance. We obtain an adequate fit to the data from this model, but
the value is not significantly better than the baseline model (i.e., the model as pictured in
2
Figure 1) (∆χ [1] = .13, n.s.). For the model tests and their fit indexes, see Table 3.
As the difference is not significant, we conclude that the direct path from value
congruence to innovation performance is insignificant; therefore, innovation intention
fully mediates the effect of value congruence on innovation performance. Similarly, we
105