


 273 /304

273
臺大管理論叢
第
28
卷第
1
期
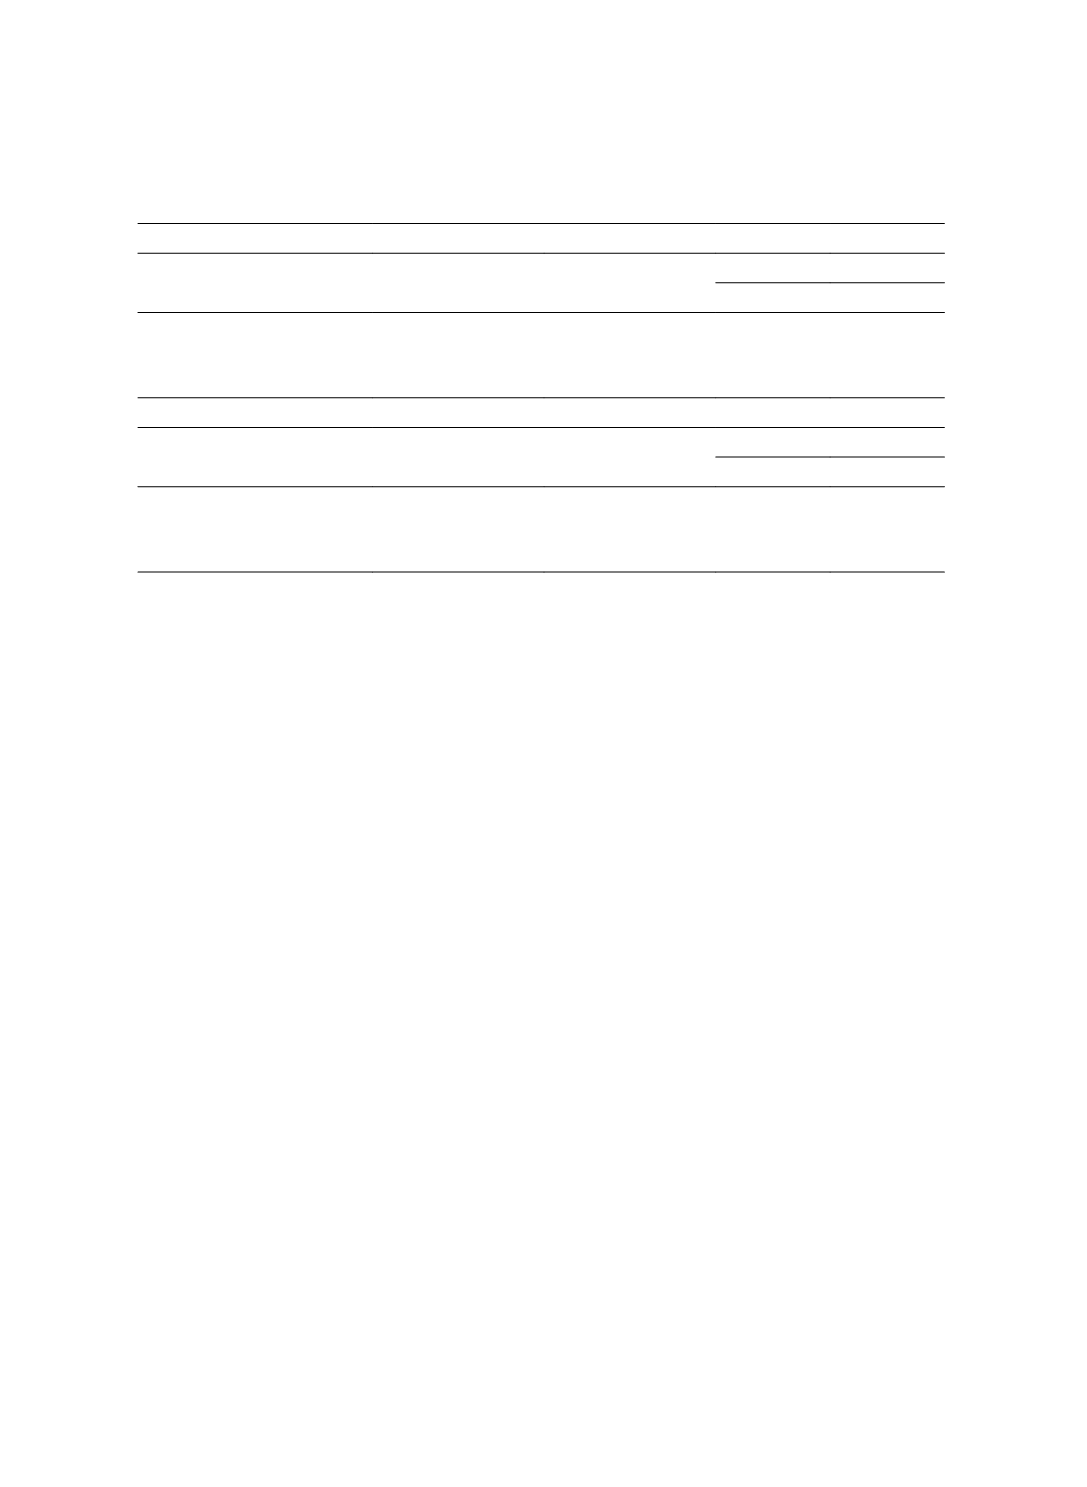
Table 5 Ratio of Effective ICFR Disclosures
Panel A: SOX 302 and SOX 404
SOX 302 Sample
(1)
SOX 404 Sample
(2)
Difference
(2) - (1)
p-value
Restatement Companies
0.976
0.790
-0.186
<0.001
Non-restatement
Companies
0.997
0.976
-0.020
<0.001
Panel B: AS2 and AS5
AS2 Sample
(1)
AS5 Sample
(2)
Difference
(2) - (1)
p-value
Restatement Companies
0.715
0.886
0.171
<0.001
Non-restatement
Companies
0.963
0.986
0.023
<0.001
Table 6 presents the Pearson correlation matrix for all variables used in the study. The
strongest pairwise correlation is -0.484, and the largest variance inflation factors are less
than 2.3. We have not found any multicollinearity problems in our sample.