
期貨未平倉量的資訊內涵及其交易活動之研究
170
(1991) on trading date
t
, respectively. All of the spot volatility proxies are multiplied by 10
6
.
TTM
t
is the time-to-maturity (in days) of the highest open interest futures contracts.
D
j
(
j
= 1, 2, 3, 4)
are the four daily dummies for the day-of-the-week effect. Numbers in parentheses for
regression coefficients are t-values. The statistics of H
0
are the F-values. The superscript a, b
and c indicate significance at the 1%, 5% and 10% confidence levels, respectively.
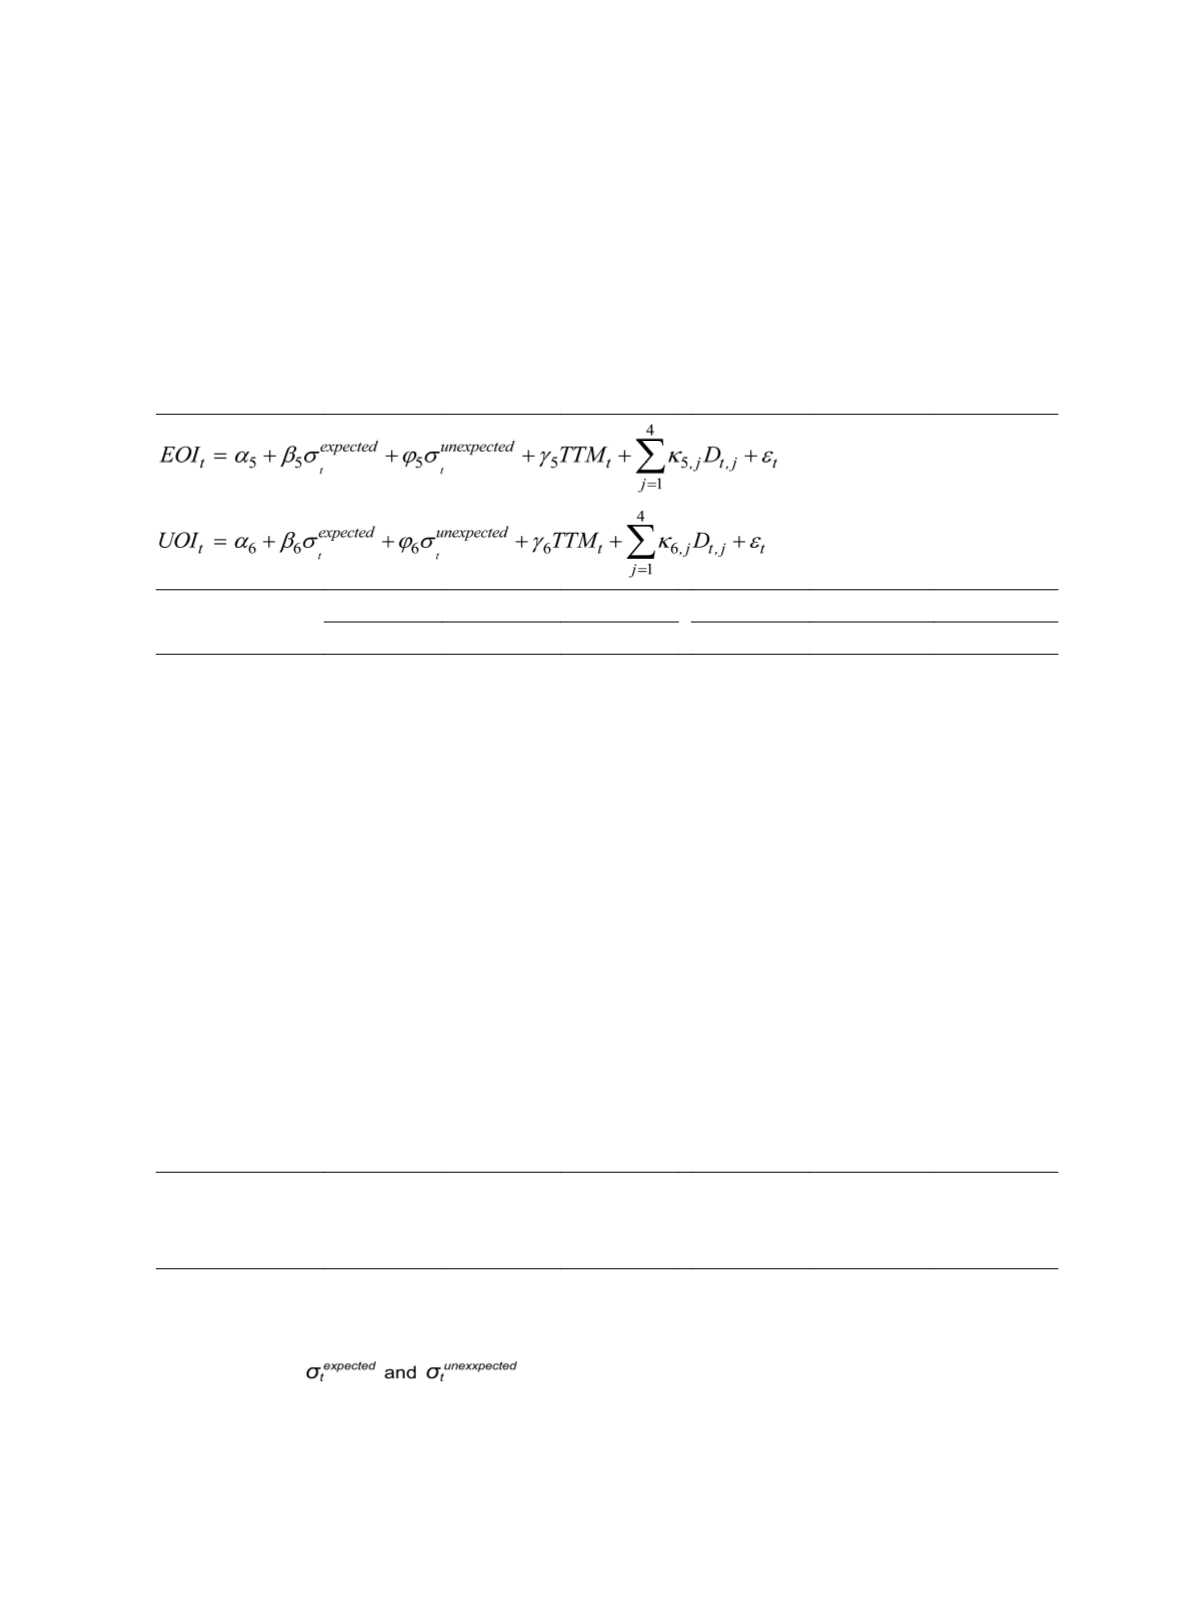
Table 5 Regressions of Open Interest on Expected and Unexpected Spot Volatility
(5)
(6)
Volatility Proxies
Model (5)
Model (6)
Parkinson
t
GK
t
RS
t
Parkinson
t
GK
t
RS
t
Intercept (
α
)
49,047
a
(45.23)
49,083
a
(44.61)
49,243
a
(45.35)
2,735
a
(10.90)
2,814
a
(11.06)
2,778
a
(11.06)
Volatility
Expected (
β
)
14.20
a
(4.58)
17.59
a
(4.44)
16.75
a
(4.21)
-1.03
(-1.44)
-1.98
b
(-2.16)
-2.10
b
(-2.28)
Unexpected (
φ
)
6.28
b
(2.35)
9.06
a
(2.79)
8.13
b
(2.58)
0.26
(0.42)
-0.036
(-0.05)
-0.60
(-0.82)
TTM
t
(
γ
)
-121.17
a
(-3.50)
-123.32
a
(-3.56)
-123.98
b
(-3.58)
-83.97
a
(-10.48)
-83.71
a
(-10.45)
-83.66
a
(-10.44)
Monday (
κ
1
)
-2,461
a
(-2.43)
-2,506
b
(-2.47)
-2,523
b
(-2.48)
-472.18
c
(-2.01)
-456.14
c
(-1.94)
-455.53
c
(-1.94)
Tuesday (
κ
2
)
-669.43
(-0.67)
-761.11
(-0.76)
-781.73
(-0.78)
-138.34
(-0.60)
-119.52
(-0.52)
-118.86
(-0.51)
Thursday (
κ
3
)
299.80
a
(0.30)
185.26
(0.19)
158.04
(0.16)
-3,095
a
(-13.41)
-3,080
a
(-13.35)
-3,073
a
(-13.32)
Friday (
κ
4
)
-2,216
b
(-2.21)
-2,251
b
(-2.25)
-2,274
b
(-2.27)
-641.85
a
(-2.77)
-639.76
a
(-2.76)
-633.64
a
(-2.74)
H
0
:
β
i
=
ϕ
i
7.74
a
5.31
b
5.94
b
3.86
b
5.16
b
3.38
c
H
0
: All
κ
= 0
3.10
b
3.03
b
3.03
b
59.66
a
59.44
a
59.17
a
Adj. R
2
0.0159
0.0155
0.0145
0.1406
0.1414
0.1412
Note: Regressions (5) and (6) are used to examine the implications of Hypothesis 2. The dependent
variables are
EOI
t
and
UOI
t
are, respectively, the expected and unexpected component of open
interest partitioned from
OI
t
using ARIMA model, where
OI
t
is the two nearest expiration futures
contracts.
are, respectively, the expected and unexpected component
of spot volatility proxy, which is measured by Parkinson (1980), Garman and Klass (1980) and
Rogers and Satchell (1991) in different regressions. All of the spot volatility proxies are multiplied
by 10
6
, and each spot volatility proxy is partitioned into the expected and unexpected volatilities


