Page 132 - 33-3
P. 132

Goal Consensus, Subordinates’ Prior Performances, and Supervisors’ Resource Allocation Preferences


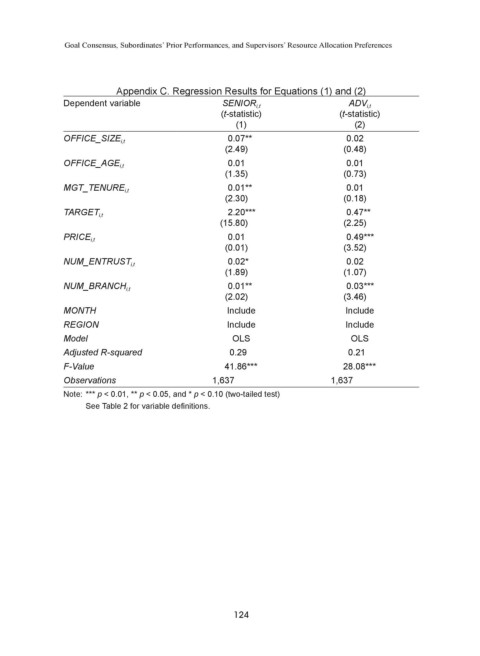
                           Appendix C. Regression Results for Equations (1) and (2)
               Dependent variable                  SENIOR i,t                  ADV i,t
                                                   (t-statistic)             (t-statistic)
                                                      (1)                        (2)
                                                    0.07**                     0.02
               OFFICE_SIZE i,t
                                                   (2.49)                     (0.48)
                                                    0.01                       0.01
               OFFICE_AGE i,t
                                                   (1.35)                     (0.73)
                                                    0.01**                     0.01
               MGT_TENURE i,t
                                                   (2.30)                     (0.18)
                                                    2.20***                    0.47**
               TARGET i,t
                                                  (15.80)                     (2.25)
                                                    0.01                       0.49***
               PRICE i,t
                                                   (0.01)                     (3.52)
                                                    0.02*                      0.02
               NUM_ENTRUST i,t
                                                   (1.89)                     (1.07)
                                                    0.01**                     0.03***
               NUM_BRANCH i,t
                                                   (2.02)                     (3.46)
               MONTH                                Include                    Include
               REGION                               Include                    Include
               Model                                 OLS                        OLS
               Adjusted R-squared                    0.29                      0.21
               F-Value                             41.86***                   28.08***
               Observations                      1,637                     1,637
               Note: *** p < 0.01, ** p < 0.05, and * p < 0.10 (two-tailed test)
                    See Table 2 for variable definitions.


                                                     124
   127   128   129   130   131   132   133   134   135   136   137