
Page 183 - 臺大管理論叢第33卷第1期
P. 183
NTU Management Review Vol. 33 No. 1 Apr. 2023
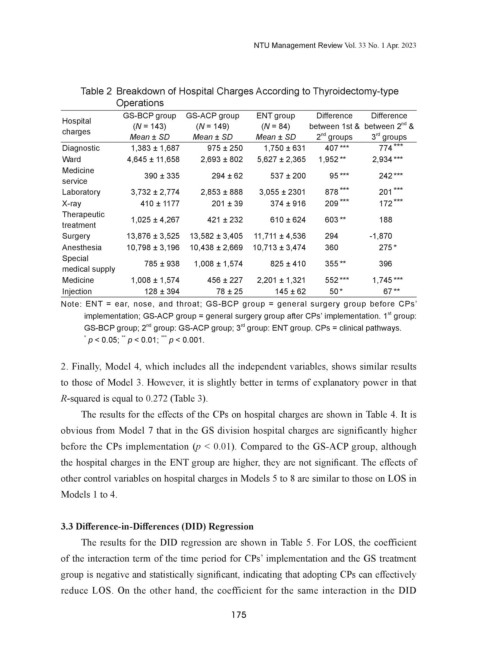
Table 2 Breakdown of Hospital Charges According to Thyroidectomy-type
Operations
GS-BCP group GS-ACP group ENT group Difference Difference
Hospital (N = 143) (N = 149) (N = 84) between 1st & between 2 &
nd
charges nd rd
Mean ± SD Mean ± SD Mean ± SD 2 groups 3 groups
Diagnostic 1,383 ± 1,687 975 ± 250 1,750 ± 631 407 *** 774 ***
Ward 4,645 ± 11,658 2,693 ± 802 5,627 ± 2,365 1,952 ** 2,934 ***
Medicine 390 ± 335 294 ± 62 537 ± 200 95 *** 242 ***
service
Laboratory 3,732 ± 2,774 2,853 ± 888 3,055 ± 2301 878 *** 201 ***
X-ray 410 ± 1177 201 ± 39 374 ± 916 209 *** 172 ***
Therapeutic 1,025 ± 4,267 421 ± 232 610 ± 624 603 ** 188
treatment
Surgery 13,876 ± 3,525 13,582 ± 3,405 11,711 ± 4,536 294 -1,870
Anesthesia 10,798 ± 3,196 10,438 ± 2,669 10,713 ± 3,474 360 275 *
Special 785 ± 938 1,008 ± 1,574 825 ± 410 355 ** 396
medical supply
Medicine 1,008 ± 1,574 456 ± 227 2,201 ± 1,321 552 *** 1,745 ***
Injection 128 ± 394 78 ± 25 145 ± 62 50 * 67 **
Note: ENT = ear, nose, and throat; GS-BCP group = general surgery group before CPs’
st
implementation; GS-ACP group = general surgery group after CPs’ implementation. 1 group:
GS-BCP group; 2 group: GS-ACP group; 3 group: ENT group. CPs = clinical pathways.
rd
nd
* p < 0.05; p < 0.01; p < 0.001.
***
**
2. Finally, Model 4, which includes all the independent variables, shows similar results
to those of Model 3. However, it is slightly better in terms of explanatory power in that
R-squared is equal to 0.272 (Table 3).
The results for the effects of the CPs on hospital charges are shown in Table 4. It is
obvious from Model 7 that in the GS division hospital charges are significantly higher
before the CPs implementation (p < 0.01). Compared to the GS-ACP group, although
the hospital charges in the ENT group are higher, they are not significant. The effects of
other control variables on hospital charges in Models 5 to 8 are similar to those on LOS in
Models 1 to 4.
3.3 Difference-in-Differences (DID) Regression
The results for the DID regression are shown in Table 5. For LOS, the coefficient
of the interaction term of the time period for CPs’ implementation and the GS treatment
group is negative and statistically significant, indicating that adopting CPs can effectively
reduce LOS. On the other hand, the coefficient for the same interaction in the DID
175