
Page 151 - 臺大管理論叢第32卷第2期
P. 151
NTU Management Review Vol. 32 No. 2 Aug. 2022
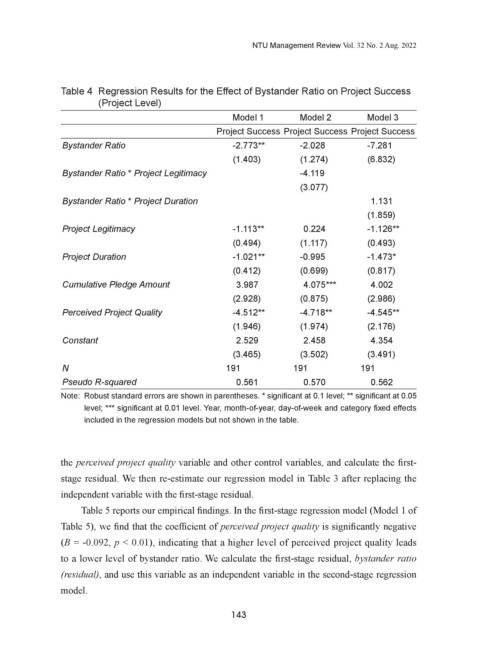
Table 4 Regression Results for the Effect of Bystander Ratio on Project Success
(Project Level)
Model 1 Model 2 Model 3
Project Success Project Success Project Success
Bystander Ratio -2.773** -2.028 -7.281
(1.403) (1.274) (6.832)
Bystander Ratio * Project Legitimacy -4.119
(3.077)
Bystander Ratio * Project Duration 1.131
(1.859)
Project Legitimacy -1.113** 0.224 -1.126**
(0.494) (1.117) (0.493)
Project Duration -1.021** -0.995 -1.473*
(0.412) (0.699) (0.817)
Cumulative Pledge Amount 3.987 4.075*** 4.002
(2.928) (0.875) (2.986)
Perceived Project Quality -4.512** -4.718** -4.545**
(1.946) (1.974) (2.176)
Constant 2.529 2.458 4.354
(3.465) (3.502) (3.491)
N 191 191 191
Pseudo R-squared 0.561 0.570 0.562
Note: Robust standard errors are shown in parentheses. * significant at 0.1 level; ** significant at 0.05
level; *** significant at 0.01 level. Year, month-of-year, day-of-week and category fixed effects
included in the regression models but not shown in the table.
the perceived project quality variable and other control variables, and calculate the first-
stage residual. We then re-estimate our regression model in Table 3 after replacing the
independent variable with the first-stage residual.
Table 5 reports our empirical findings. In the first-stage regression model (Model 1 of
Table 5), we find that the coefficient of perceived project quality is significantly negative
(B = -0.092, p < 0.01), indicating that a higher level of perceived project quality leads
to a lower level of bystander ratio. We calculate the first-stage residual, bystander ratio
(residual), and use this variable as an independent variable in the second-stage regression
model.
143