
Page 148 - 臺大管理論叢第32卷第2期
P. 148
The More, the Merrier? The Bystander Effect on Crowdfunding Platforms
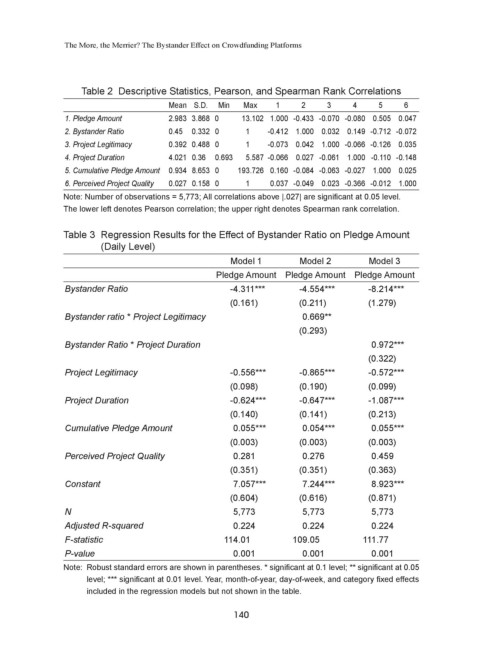
Table 2 Descriptive Statistics, Pearson, and Spearman Rank Correlations
Mean S.D. Min Max 1 2 3 4 5 6
1. Pledge Amount 2.983 3.868 0 13.102 1.000 -0.433 -0.070 -0.080 0.505 0.047
2. Bystander Ratio 0.45 0.332 0 1 -0.412 1.000 0.032 0.149 -0.712 -0.072
3. Project Legitimacy 0.392 0.488 0 1 -0.073 0.042 1.000 -0.066 -0.126 0.035
4. Project Duration 4.021 0.36 0.693 5.587 -0.066 0.027 -0.061 1.000 -0.110 -0.148
5. Cumulative Pledge Amount 0.934 8.653 0 193.726 0.160 -0.084 -0.063 -0.027 1.000 0.025
6. Perceived Project Quality 0.027 0.158 0 1 0.037 -0.049 0.023 -0.366 -0.012 1.000
Note: Number of observations = 5,773; All correlations above |.027| are significant at 0.05 level.
The lower left denotes Pearson correlation; the upper right denotes Spearman rank correlation.
Table 3 Regression Results for the Effect of Bystander Ratio on Pledge Amount
(Daily Level)
Model 1 Model 2 Model 3
Pledge Amount Pledge Amount Pledge Amount
Bystander Ratio -4.311*** -4.554*** -8.214***
(0.161) (0.211) (1.279)
Bystander ratio * Project Legitimacy 0.669**
(0.293)
Bystander Ratio * Project Duration 0.972***
(0.322)
Project Legitimacy -0.556*** -0.865*** -0.572***
(0.098) (0.190) (0.099)
Project Duration -0.624*** -0.647*** -1.087***
(0.140) (0.141) (0.213)
Cumulative Pledge Amount 0.055*** 0.054*** 0.055***
(0.003) (0.003) (0.003)
Perceived Project Quality 0.281 0.276 0.459
(0.351) (0.351) (0.363)
Constant 7.057*** 7.244*** 8.923***
(0.604) (0.616) (0.871)
N 5,773 5,773 5,773
Adjusted R-squared 0.224 0.224 0.224
F-statistic 114.01 109.05 111.77
P-value 0.001 0.001 0.001
Note: Robust standard errors are shown in parentheses. * significant at 0.1 level; ** significant at 0.05
level; *** significant at 0.01 level. Year, month-of-year, day-of-week, and category fixed effects
included in the regression models but not shown in the table.
140