


 248 /302

顧客與供應商關係與成本結構
248
Soderstrom, 1994, 1997). A stream of research proposes the cost behavior that recognizes
the role of managers in adjusting committed resources in response to changes in activity-
based demand. Noreen and Soderstrom (1997) find that costs are more difficult to adjust
when activities decrease because costs increase more sensitively in response to the
increase in activity than they fall in response to the decrease in activity.
Building upon findings by these studies, Anderson et al. (2003) label this cost
behavior that the magnitude of the increases in costs associated with an increase in volume
is greater than the magnitude of the decrease in costs associated with an equivalent
decrease in volume as “sticky”, and establish an empirical model to test this cost behavior.
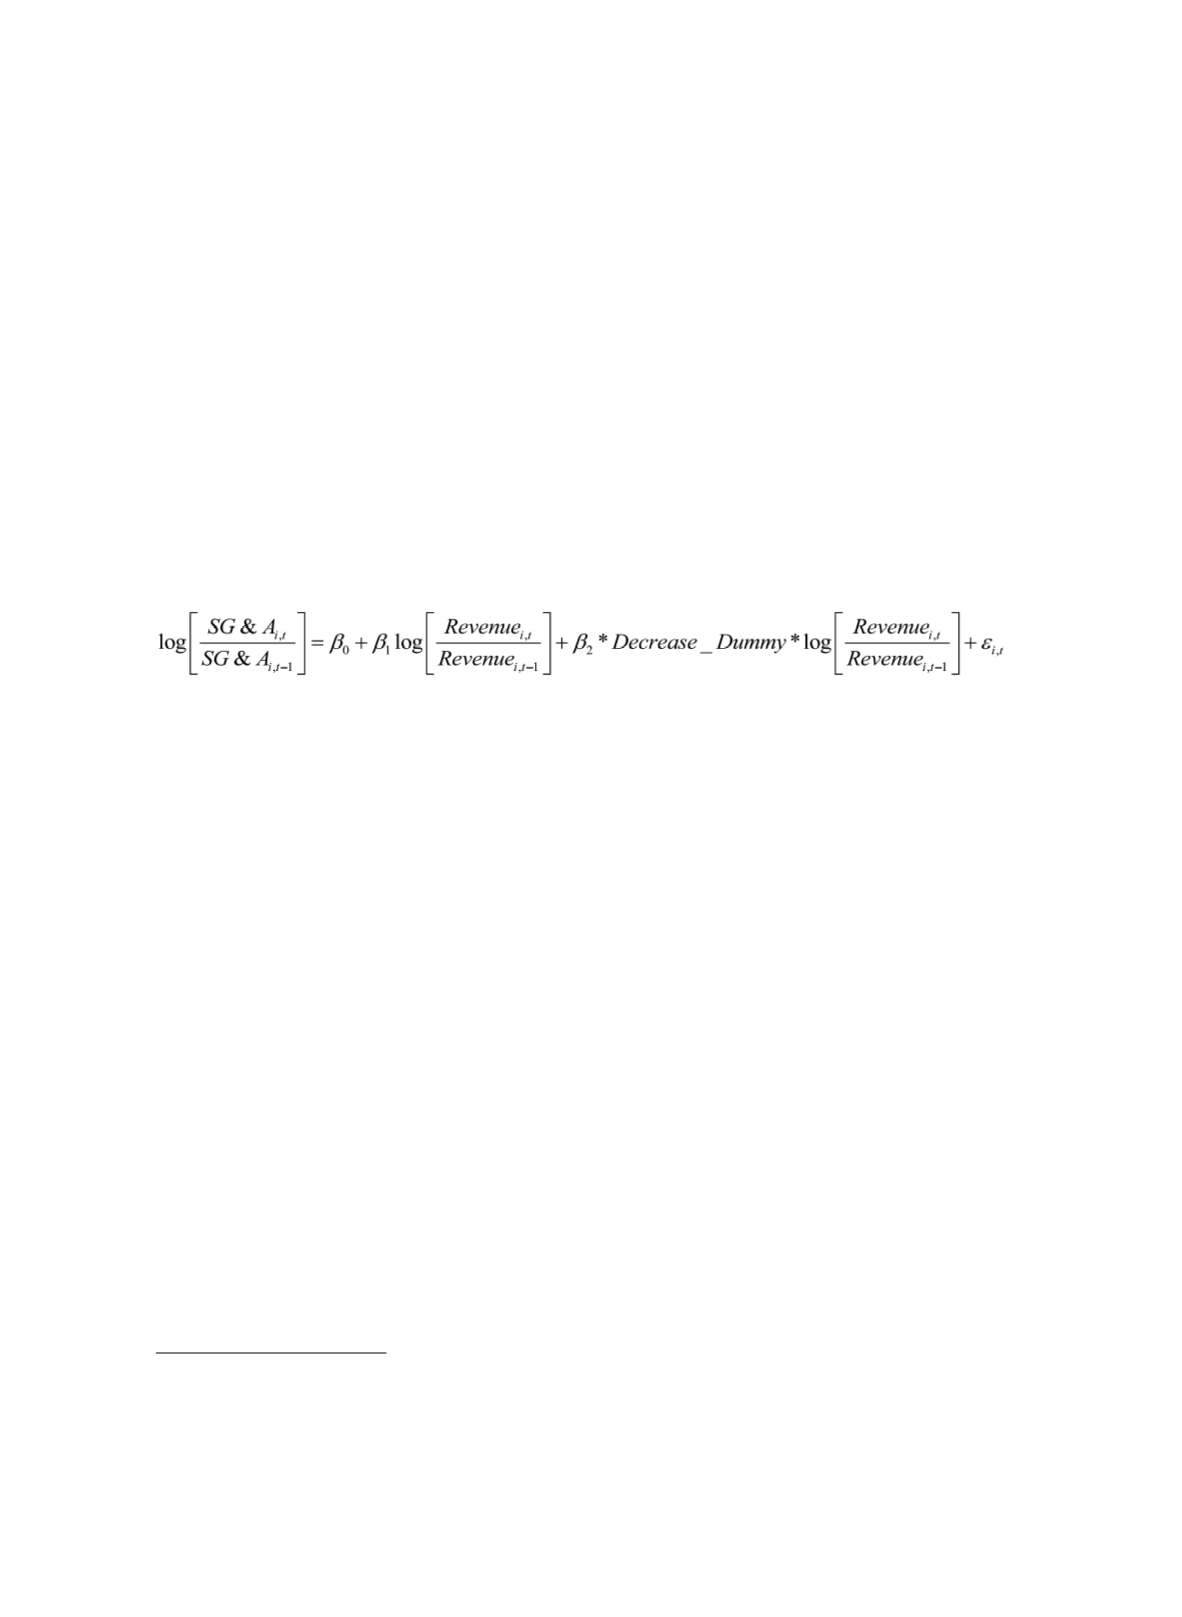
In their study, they propose the following model:
3
(1)
This model provides the basis for the test of stickiness of SG&A costs. The model is
written in ratio to improve the comparability of the variable across firms, and in
logarithmic form to reduce the effect of potential heteroskedasticity problem. In this
model, the coefficient
β
1
measures the percentage increase in SG&A costs with a 1%
increase in sales revenue. The value of
Decreased_Dummy
is 1 when revenue decreases
between period
t-1
and
t
, and 0 otherwise. Therefore,
β
1
+
β
2
measures the percentage
increase in SG&A costs with 1% decrease in sales revenue. They focus on selling, general,
and administrative (SG&A) costs in relation to revenue activity because sales volume will
affect many of the elements of SG&A cost. If SG&A costs are sticky, the percentage
increase in SG&A costs for an increase in sales revenue should be larger than the
percentage decrease in SG&A costs for an equivalent decrease in sales revenue.
Using 7,629 U.S. firms over 1979 to 1998, Anderson et al. (2003) provides empirical
evidences that SG&A costs increase on average 0.55% per 1% increase in sales but
decrease only 0.35% per 1% decrease in sales. Subsequent studies document that cost
stickiness is pervasive and holds across different cost categories such as cost of goods
3 Anderson et al. (2003) choose SG&A costs as their major interest because "SG&A cost can be
meaningfully studied in relation to revenue activity because sales volume drives many of the
components of SG&A costs "(Cooper and Kaplan, 1998). CFO magazine also did an extensive
analysis of SG&A costs in relation to sales revenue in its annual SG&A survey.