
Page 36 - 33-3
P. 36
Optimal Allocation of Capacitated Facilities Considering Time-Dependent User Preference for User Number
Maximization
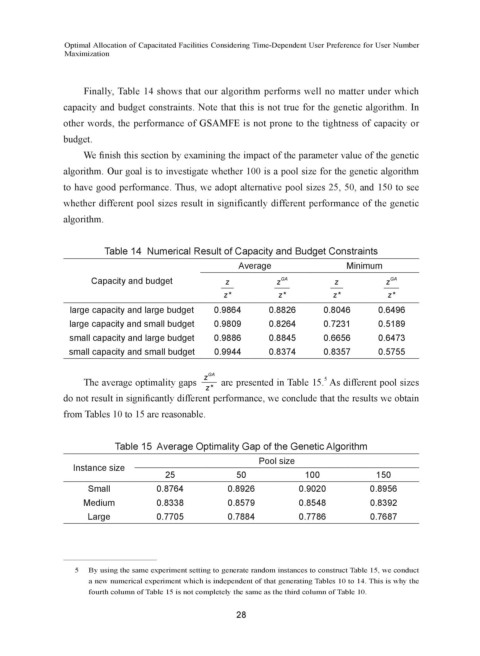
Finally, Table 14 shows that our algorithm performs well no matter under which
capacity and budget constraints. Note that this is not true for the genetic algorithm. In
other words, the performance of GSAMFE is not prone to the tightness of capacity or
budget.
We finish this section by examining the impact of the parameter value of the genetic
algorithm. Our goal is to investigate whether 100 is a pool size for the genetic algorithm
to have good performance. Thus, we adopt alternative pool sizes 25, 50, and 150 to see
whether different pool sizes result in significantly different performance of the genetic
algorithm.
Table 14 Numerical Result of Capacity and Budget Constraints
Average Minimum
Capacity and budget z z GA z z GA
z* z* z* z*
large capacity and large budget 0.9864 0.8826 0.8046 0.6496
large capacity and small budget 0.9809 0.8264 0.7231 0.5189
small capacity and large budget 0.9886 0.8845 0.6656 0.6473
small capacity and small budget 0.9944 0.8374 0.8357 0.5755
GA
z
5
The average optimality gaps are presented in Table 15. As different pool sizes
z*
do not result in significantly different performance, we conclude that the results we obtain
from Tables 10 to 15 are reasonable.
Table 15 Average Optimality Gap of the Genetic Algorithm
Pool size
Instance size
25 50 100 150
Small 0.8764 0.8926 0.9020 0.8956
Medium 0.8338 0.8579 0.8548 0.8392
Large 0.7705 0.7884 0.7786 0.7687
5 By using the same experiment setting to generate random instances to construct Table 15, we conduct
a new numerical experiment which is independent of that generating Tables 10 to 14. This is why the
fourth column of Table 15 is not completely the same as the third column of Table 10.
28