
Page 71 - 臺大管理論叢第33卷第1期
P. 71
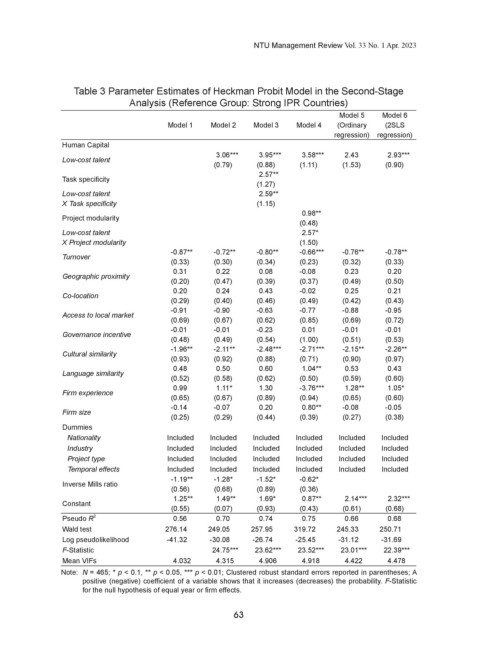
NTU Management Review Vol. 33 No. 1 Apr. 2023


                  Table 3 Parameter Estimates of Heckman Probit Model in the Second-Stage
                              Analysis (Reference Group: Strong IPR Countries)
                                                                             Model 5   Model 6
                                       Model 1  Model 2   Model 3   Model 4  (Ordinary   (2SLS
                                                                            regression)  regression)
               Human Capital
                                                 3.06***   3.95***   3.58***   2.43     2.93***
               Low-cost talent
                                                 (0.79)    (0.88)   (1.11)    (1.53)    (0.90)
                                                           2.57**
               Task specificity
                                                           (1.27)
               Low-cost talent                             2.59**
               X Task specificity                          (1.15)
                                                                     0.98**
               Project modularity
                                                                    (0.48)
               Low-cost talent                                       2.57*
               X Project modularity                                 (1.50)
                                       -0.87**   -0.72**   -0.80**   -0.66***  -0.76**  -0.78**
               Turnover
                                       (0.33)    (0.30)    (0.34)   (0.23)    (0.32)    (0.33)
                                        0.31     0.22      0.08     -0.08     0.23      0.20
               Geographic proximity
                                       (0.20)    (0.47)    (0.39)   (0.37)    (0.49)    (0.50)
                                        0.20     0.24      0.43     -0.02     0.25      0.21
               Co-location
                                       (0.29)    (0.40)    (0.46)   (0.49)    (0.42)    (0.43)
                                       -0.91     -0.90     -0.63    -0.77     -0.88     -0.95
               Access to local market
                                       (0.69)    (0.67)    (0.62)   (0.85)    (0.69)    (0.72)
                                       -0.01     -0.01     -0.23     0.01     -0.01     -0.01
               Governance incentive
                                       (0.48)    (0.49)    (0.54)   (1.00)    (0.51)    (0.53)
                                       -1.96**   -2.11**   -2.48***  -2.71***   -2.15**  -2.26**
               Cultural similarity
                                       (0.93)    (0.92)    (0.88)   (0.71)    (0.90)    (0.97)
                                        0.48     0.50      0.60      1.04**   0.53      0.43
               Language similarity
                                       (0.52)    (0.58)    (0.62)   (0.50)    (0.59)    (0.60)
                                        0.99     1.11*     1.30     -3.76***  1.28**    1.05*
               Firm experience
                                       (0.65)    (0.67)    (0.89)   (0.94)    (0.65)    (0.60)
                                       -0.14     -0.07     0.20      0.80**   -0.08     -0.05
               Firm size
                                       (0.25)    (0.29)    (0.44)   (0.39)    (0.27)    (0.38)
               Dummies
                Nationality           Included  Included  Included  Included  Included  Included
                Industry              Included  Included  Included  Included  Included  Included
                Project type          Included  Included  Included  Included  Included  Included
                Temporal effects      Included  Included  Included  Included  Included  Included
                                       -1.19**   -1.28*    -1.52*   -0.62*
               Inverse Mills ratio
                                       (0.56)    (0.68)    (0.89)   (0.36)
                                        1.25**    1.49**   1.69*     0.87**   2.14***   2.32***
               Constant
                                       (0.55)    (0.07)    (0.93)   (0.43)    (0.61)    (0.68)
               Pseudo R   2             0.56     0.70      0.74      0.75     0.66      0.68
               Wald test              276.14    249.05   257.95    319.72    245.33   250.71
               Log pseudolikelihood   -41.32    -30.08    -26.74   -25.45    -31.12    -31.69
               F-Statistic                       24.75***  23.62***  23.52***  23.01***  22.39***
               Mean VIFs                4.032    4.315     4.906     4.918    4.422     4.478
               Note:  N = 465; * p < 0.1, ** p < 0.05, *** p < 0.01; Clustered robust standard errors reported in parentheses; A
                   positive (negative) coefficient of a variable shows that it increases (decreases) the probability. F-Statistic
                   for the null hypothesis of equal year or firm effects.


                                                     63