
Page 70 - 臺大管理論叢第33卷第1期
P. 70
Value Creation and Capture in Developing Countries: The Driver and Mechanism of Offshore Outsourcing
Innovation
16 0.14 0.17 -0.15 -0.01 0.05 -0.07 0.02 0.01 -0.05 -0.09 -0.08 0.03 -0.02 -0.15 -0.02 1.00
15 0.01 0.04 -0.01 -0.05 0.14 -0.03 -0.07 -0.05 -0.06 -0.03 -0.11 0.01 -0.13 0.04 1.00 -0.02
14 0.17 0.16 0.13 0.02 -0.12 0.03 0.05 -0.11 0.06 0.06 0.02 0.16 0.19 1.00 0.03 -0.16
13 0.28 0.15 0.05 0.05 -0.17 0.03 0.01 -0.16 0.11 0.03 0.04 0.21 1.00 0.17 -0.12 -0.03
-0.08 -0.02 -0.01 -0.13 -0.09
12 0.03 0.06 0.06 0.11 0.06 0.04 1.00 0.18 0.14 0.00 0.01
11 -0.06 0.13 0.05 0.10 -0.07 0.09 0.23 0.19 0.15 0.21 1.00 -0.07 0.03 0.01 -0.10 -0.09
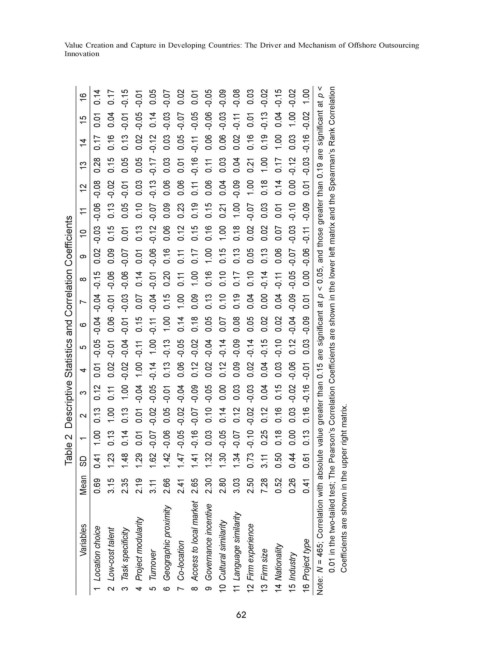
Table 2 Descriptive Statistics and Correlation Coefficients
10 -0.03 0.15 0.01 0.13 -0.12 0.06 0.12 0.15 0.16 1.00 0.18 0.02 0.02 0.07 -0.03 -0.11
0.02 0.09 0.01 0.16 0.11 0.17 1.00 0.15 0.13 0.05 0.13 0.06
9 -0.07 -0.06 -0.07 -0.06
-0.15 -0.06
8 -0.06 0.14 -0.01 0.20 0.11 1.00 0.16 0.10 0.17 0.10 -0.14 -0.11 -0.05 0.00
-0.04 -0.01 -0.03 -0.04
7 0.07 0.15 1.00 0.09 0.13 0.10 0.19 0.04 0.00 0.04 -0.09 0.01
-0.04 -0.01 -0.11 0.01 in the two-tailed test; The Pearson’s Correlation Coefficients are shown in the lower left matrix and the Spearman’s Rank Correlation
6 0.06 0.15 1.00 0.14 0.18 0.05 0.07 0.08 0.05 0.02 0.02 -0.04 -0.09
-0.05 -0.01 -0.04 -0.11 -0.13 -0.05 -0.02 -0.04
5 1.00 -0.14 -0.09 -0.14 -0.15 -0.10 0.12 0.03 Note: N = 465; Correlation with absolute value greater than 0.15 are significant at p < 0.05, and those greater than 0.19 are significant at p <
4 0.01 0.02 -0.02 1.00 -0.14 0.13 0.06 0.12 0.02 0.12 0.09 0.02 0.04 0.03 -0.06 -0.01
3 0.12 0.11 1.00 -0.04 -0.05 -0.01 -0.04 -0.09 -0.05 0.00 0.03 -0.03 0.04 0.15 -0.02 -0.16
0.13 1.00 0.13 0.01 0.05 0.10 0.14 0.12 0.12 0.16 0.03 0.16
2 -0.02 -0.02 -0.07 -0.02
1.00 0.13 0.03 0.25 0.18 0.00 0.13
1 0.14 0.01 -0.07 -0.06 -0.05 -0.16 -0.05 -0.07 -0.10
SD 0.41 1.23 1.48 1.29 1.62 1.42 1.47 1.41 1.32 1.30 1.34 0.73 3.11 0.50 0.44 0.61
Mean 0.69 3.15 2.35 2.19 3.11 2.66 2.41 2.65 2.30 2.80 3.03 2.50 7.28 0.52 0.26 0.41 Coefficients are shown in the upper right matrix.
Variables Location choice Low-cost talent Task specificity Project modularity Geographic proximity Co-location Access to local market Governance incentive Cultural similarity Language similarity Firm experience Nationality Project type
1 2 3 4 Turnover 5 6 7 8 9 10 11 12 Firm size 13 14 Industry 15 16
62